Fig. 4.
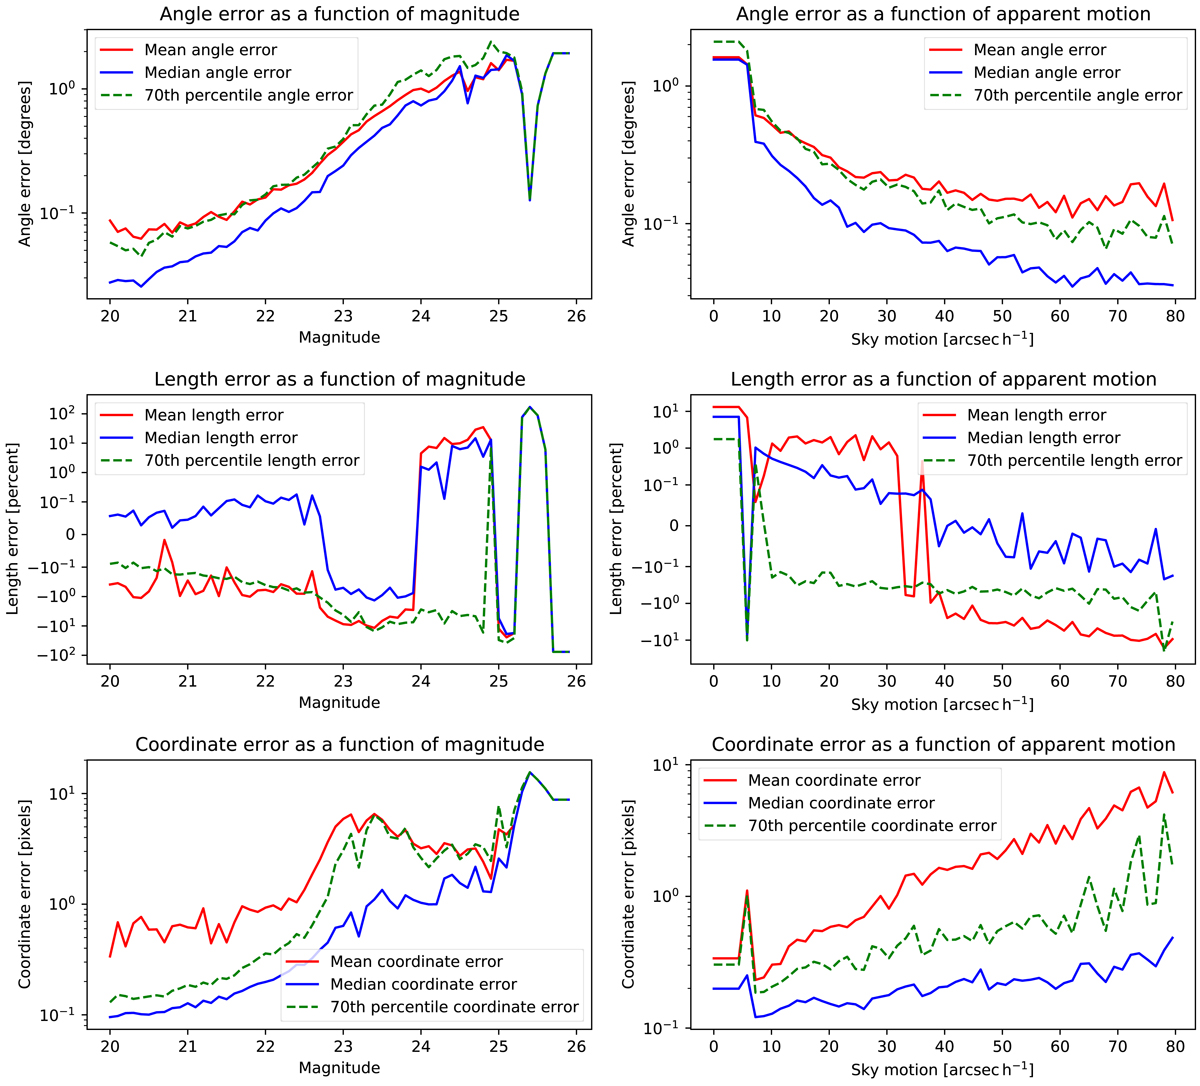
Errors in angles, lengths, and coordinates of StreakDet finds as a function of magnitude and length. The y-axes of the two uppermost and the two lowermost plots are in logarithmic scale. The y-axes of the middle plots are in symmetric logarithmic scale, where the values between −10−1 and 10−1 are shown in linear scale. In the middle plots, showing length errors, negative y-values mean that the corresponding lengths given by StreakDet are shorter than ground-truth lengths, whereas positive values mean that lengths given by StreakDet are longer than ground truth. The 70th percentile length errors in the middle plots are technically 30th percentile errors, since the length errors are typically negative.
Current usage metrics show cumulative count of Article Views (full-text article views including HTML views, PDF and ePub downloads, according to the available data) and Abstracts Views on Vision4Press platform.
Data correspond to usage on the plateform after 2015. The current usage metrics is available 48-96 hours after online publication and is updated daily on week days.
Initial download of the metrics may take a while.