Open Access
Fig. 7.
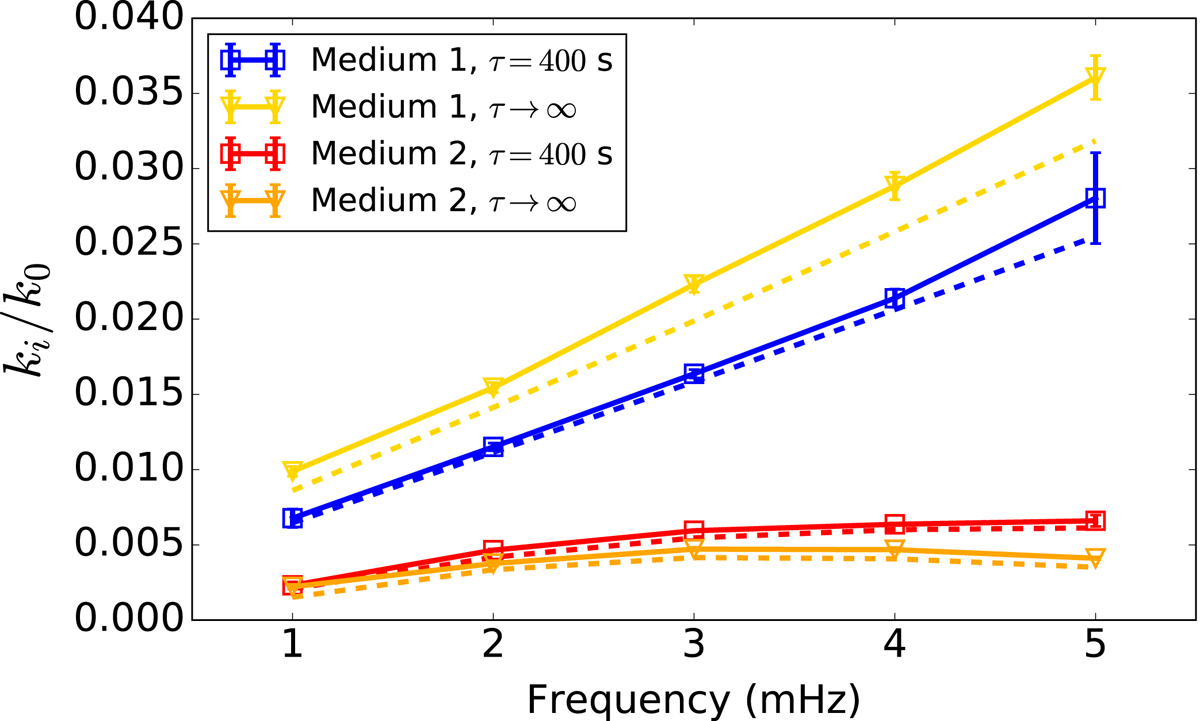
Attenuation of the coherent wave packet vs frequency for media 1 and 2, after propagation through a band of perturbed medium. The 1D theory from Keller is overplotted in dashed lines. 1 − σ error bars are shown.
Current usage metrics show cumulative count of Article Views (full-text article views including HTML views, PDF and ePub downloads, according to the available data) and Abstracts Views on Vision4Press platform.
Data correspond to usage on the plateform after 2015. The current usage metrics is available 48-96 hours after online publication and is updated daily on week days.
Initial download of the metrics may take a while.