Fig. 5.
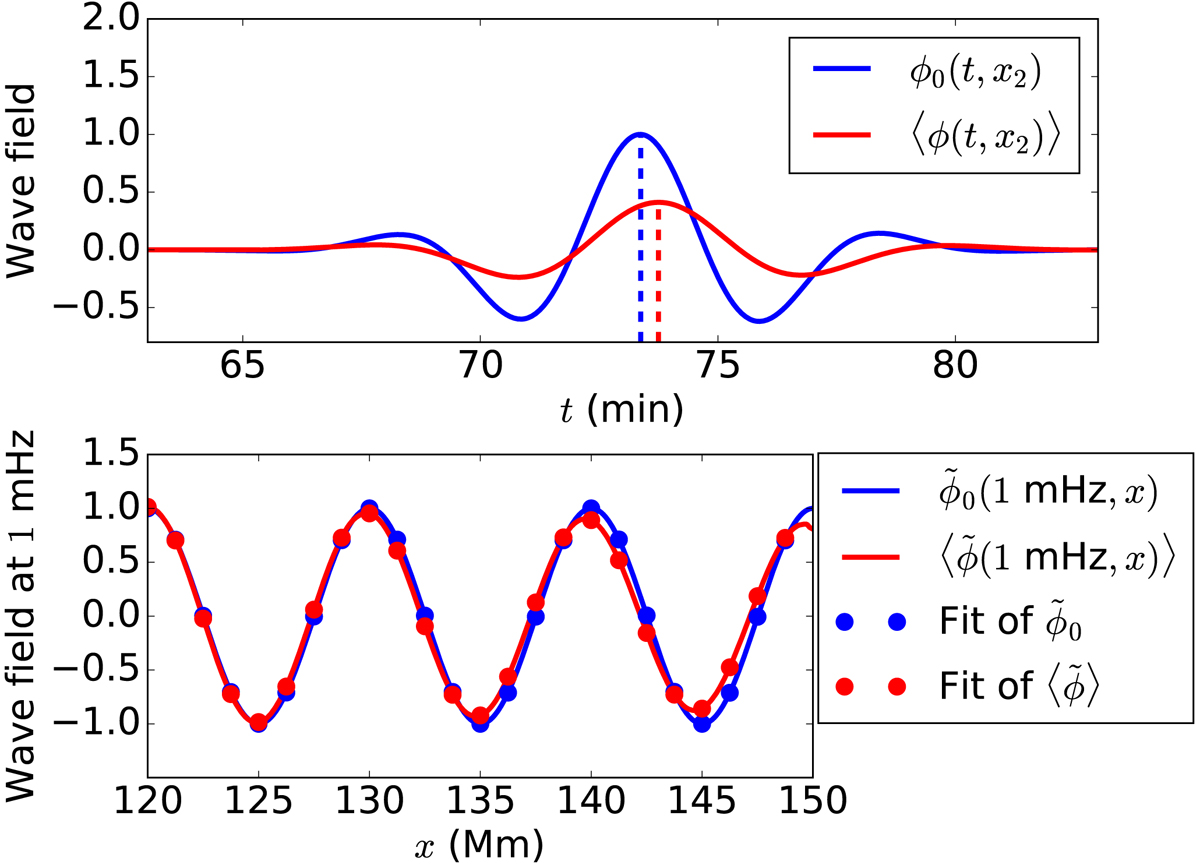
Measuring the effective wave speed. Top: Coherent wave packet (red curve) experiencing a travel time shift compared to the unperturbed wave packet (blue curve). The vertical dashed lines represent the arrival times at x2. Bottom: Fit of a decaying cosine to the real part of the temporal Fourier transform in the random region, at ω/2π = 1 mHz.
Current usage metrics show cumulative count of Article Views (full-text article views including HTML views, PDF and ePub downloads, according to the available data) and Abstracts Views on Vision4Press platform.
Data correspond to usage on the plateform after 2015. The current usage metrics is available 48-96 hours after online publication and is updated daily on week days.
Initial download of the metrics may take a while.