Fig. 4.
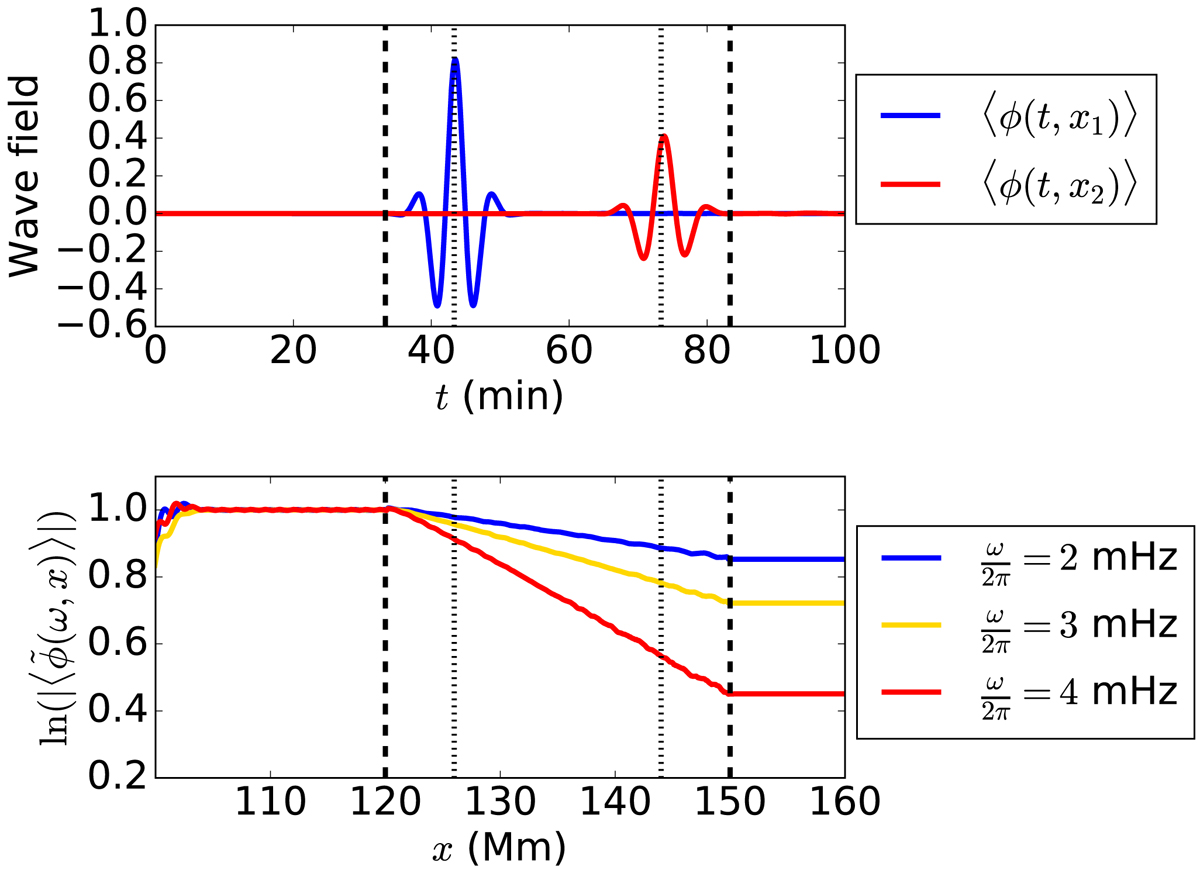
Measuring the attenuation with the temporal code. Top: Coherent wave packet at x1 = 126 Mm (blue) and x2 = 144 Mm (red). Bottom: Natural log of the spectrum of the coherent wave packet at different frequencies. We fit its slope between the vertical dotted lines, corresponding to [x1, x2]. The vertical dashed lines delimit the location of the perturbation in time (for a wave packet propagating at c0) and in space. In the figure, the Fourier components have been normalized so that they have the same amplitude before entering the perturbation.
Current usage metrics show cumulative count of Article Views (full-text article views including HTML views, PDF and ePub downloads, according to the available data) and Abstracts Views on Vision4Press platform.
Data correspond to usage on the plateform after 2015. The current usage metrics is available 48-96 hours after online publication and is updated daily on week days.
Initial download of the metrics may take a while.