Open Access
Fig. 3.
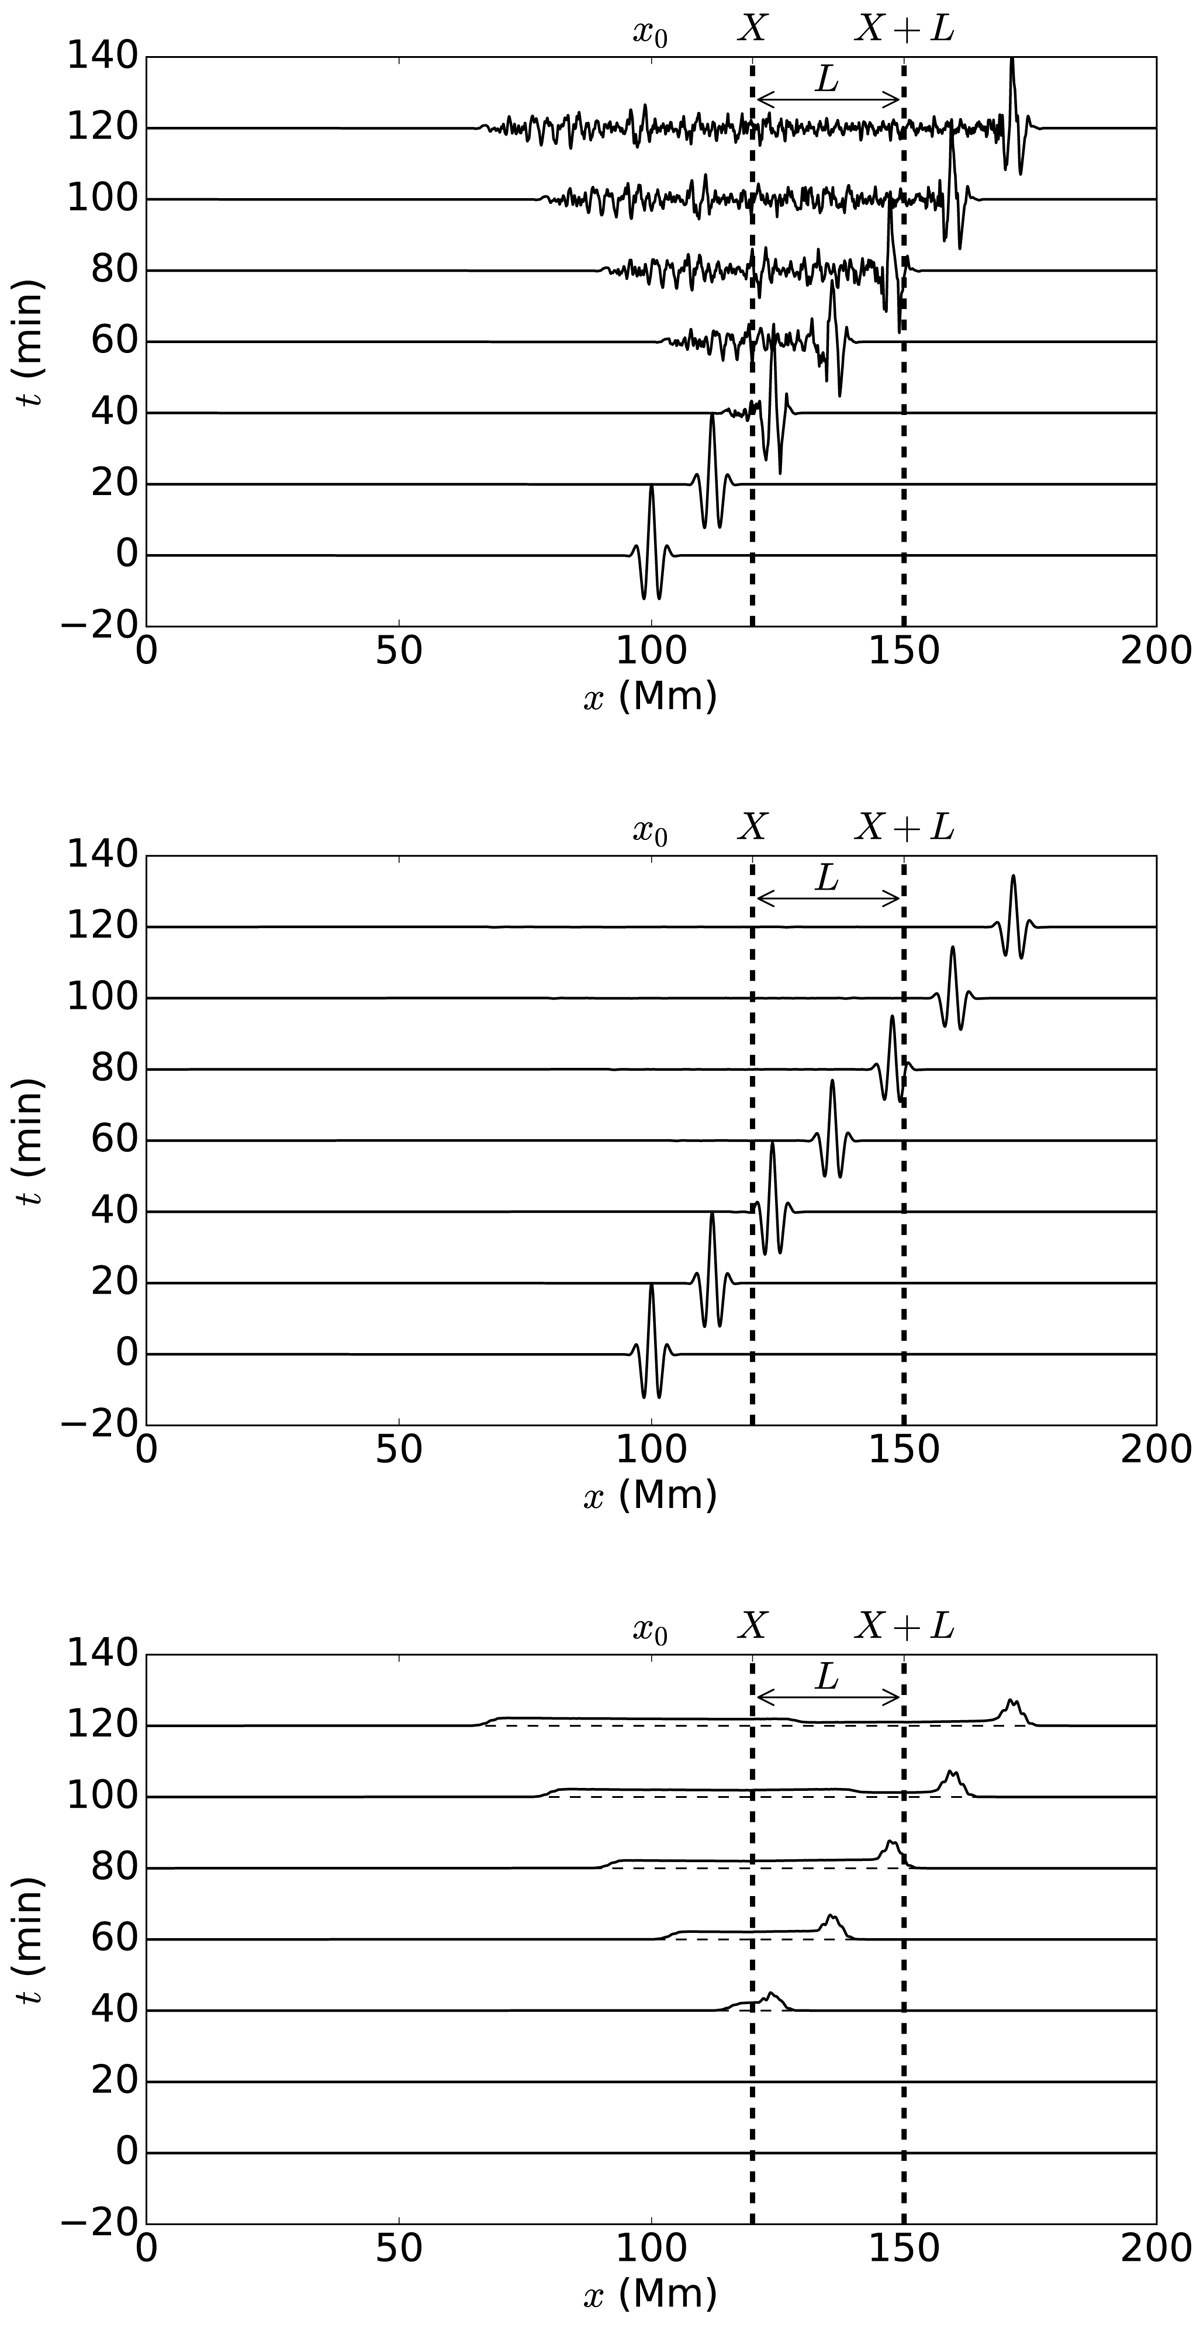
Top: wave packet propagation through a realization of a random medium (medium 2, with ϵ = 0.1 and τ = 400 s) located between the vertical dashed lines at different time steps. Middle: average over 10 000 realizations. Bottom: square root of the variance of the wave field. See the movie online.
Current usage metrics show cumulative count of Article Views (full-text article views including HTML views, PDF and ePub downloads, according to the available data) and Abstracts Views on Vision4Press platform.
Data correspond to usage on the plateform after 2015. The current usage metrics is available 48-96 hours after online publication and is updated daily on week days.
Initial download of the metrics may take a while.