Fig. F.1.
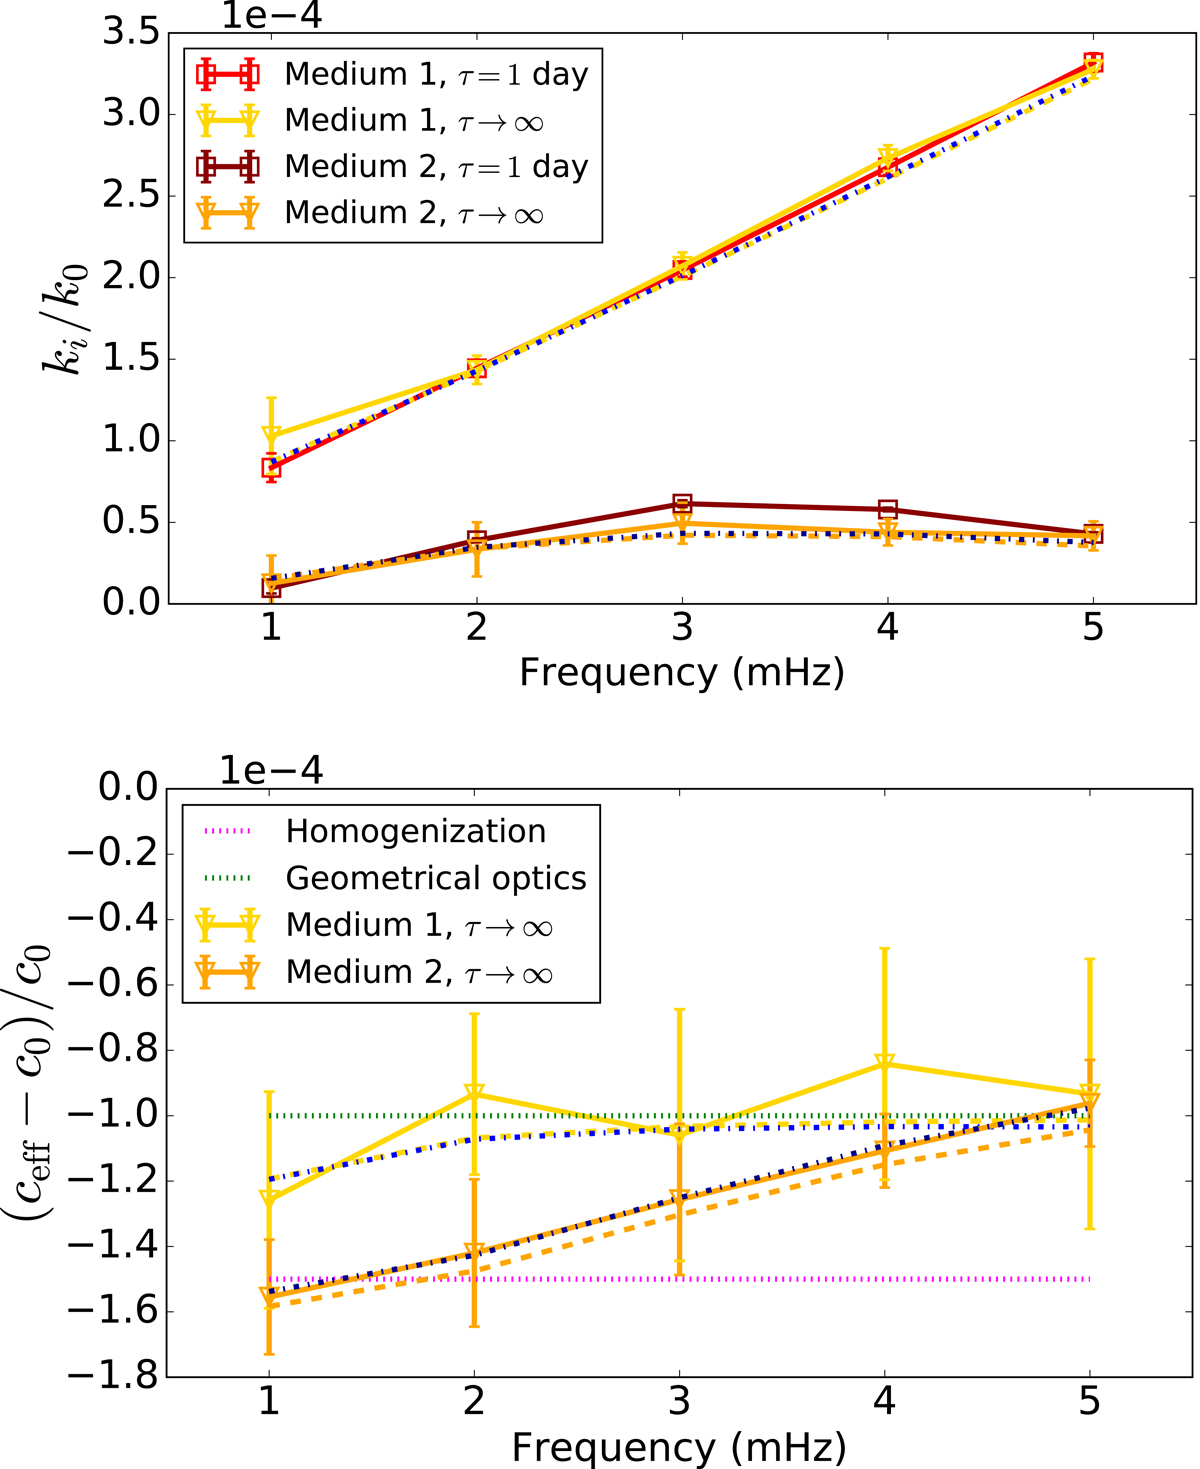
Comparison of theories with simulations for the average wave field (ϵ = 0.01). Top: attenuation. Bottom: effective wave speed. The triangles are for the simulations in frequency domain (τ → ∞), the squares for those in time domain (τ = 1 day). The two dashed-dotted blue lines are the Born solutions for media 1 and 2, while the yellow and orange dashed lines are the Keller solutions. 1 − σ error bars are shown.
Current usage metrics show cumulative count of Article Views (full-text article views including HTML views, PDF and ePub downloads, according to the available data) and Abstracts Views on Vision4Press platform.
Data correspond to usage on the plateform after 2015. The current usage metrics is available 48-96 hours after online publication and is updated daily on week days.
Initial download of the metrics may take a while.