Free Access
Fig. 8.
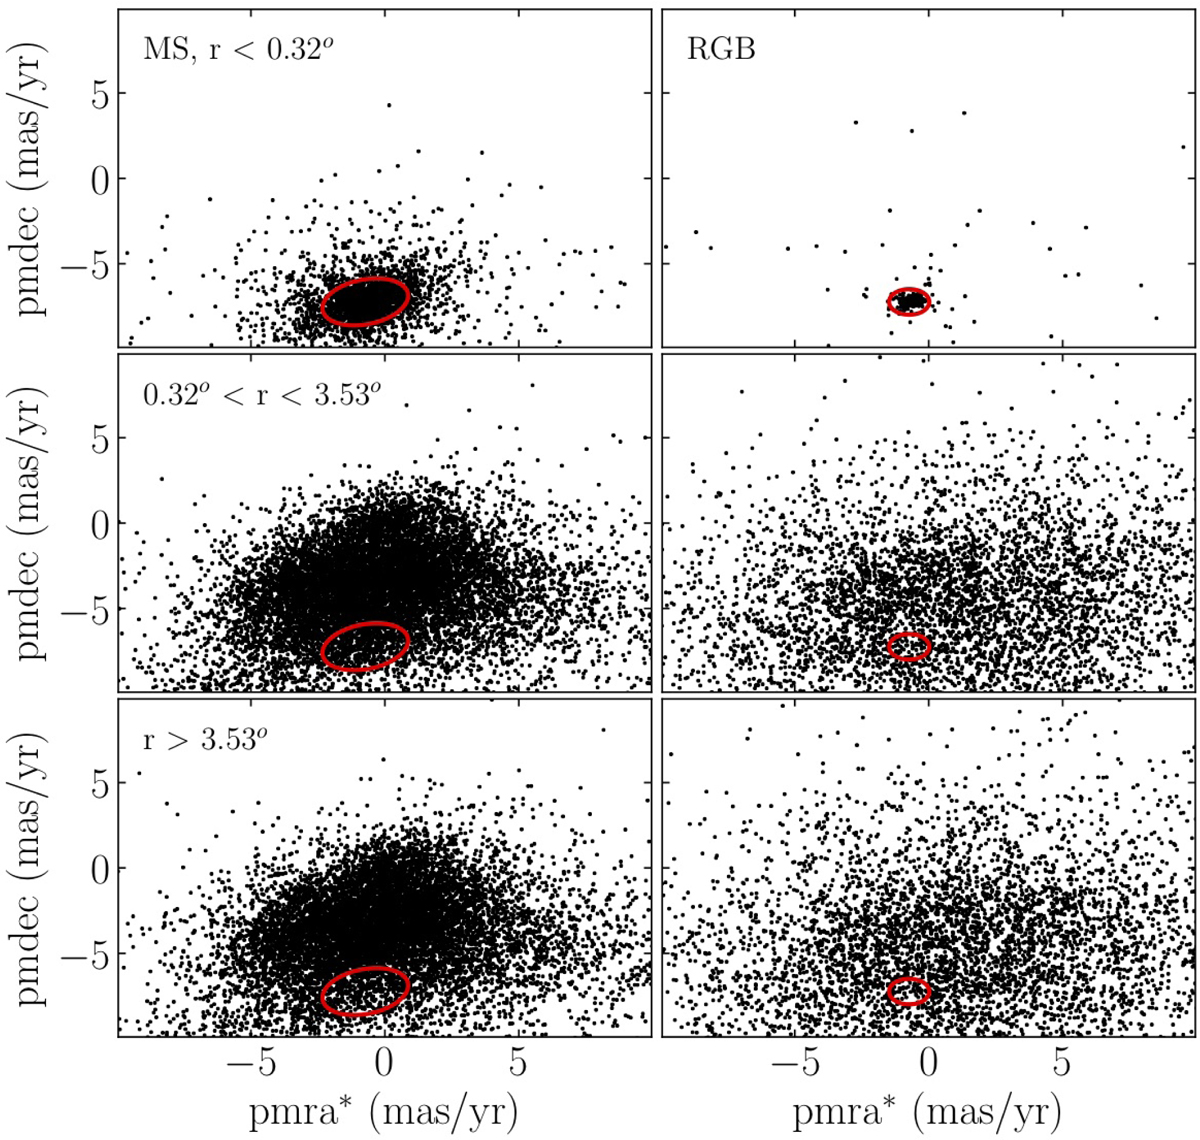
Vector point diagrams for RGB (right panels) and MS (left panels) strips of Fig. 6 for different annular regions. Red ellipses that mostly embrace cluster stars in the top panels were superimposed onto the middle and bottom panels.
Current usage metrics show cumulative count of Article Views (full-text article views including HTML views, PDF and ePub downloads, according to the available data) and Abstracts Views on Vision4Press platform.
Data correspond to usage on the plateform after 2015. The current usage metrics is available 48-96 hours after online publication and is updated daily on week days.
Initial download of the metrics may take a while.