Free Access
Fig. 6.
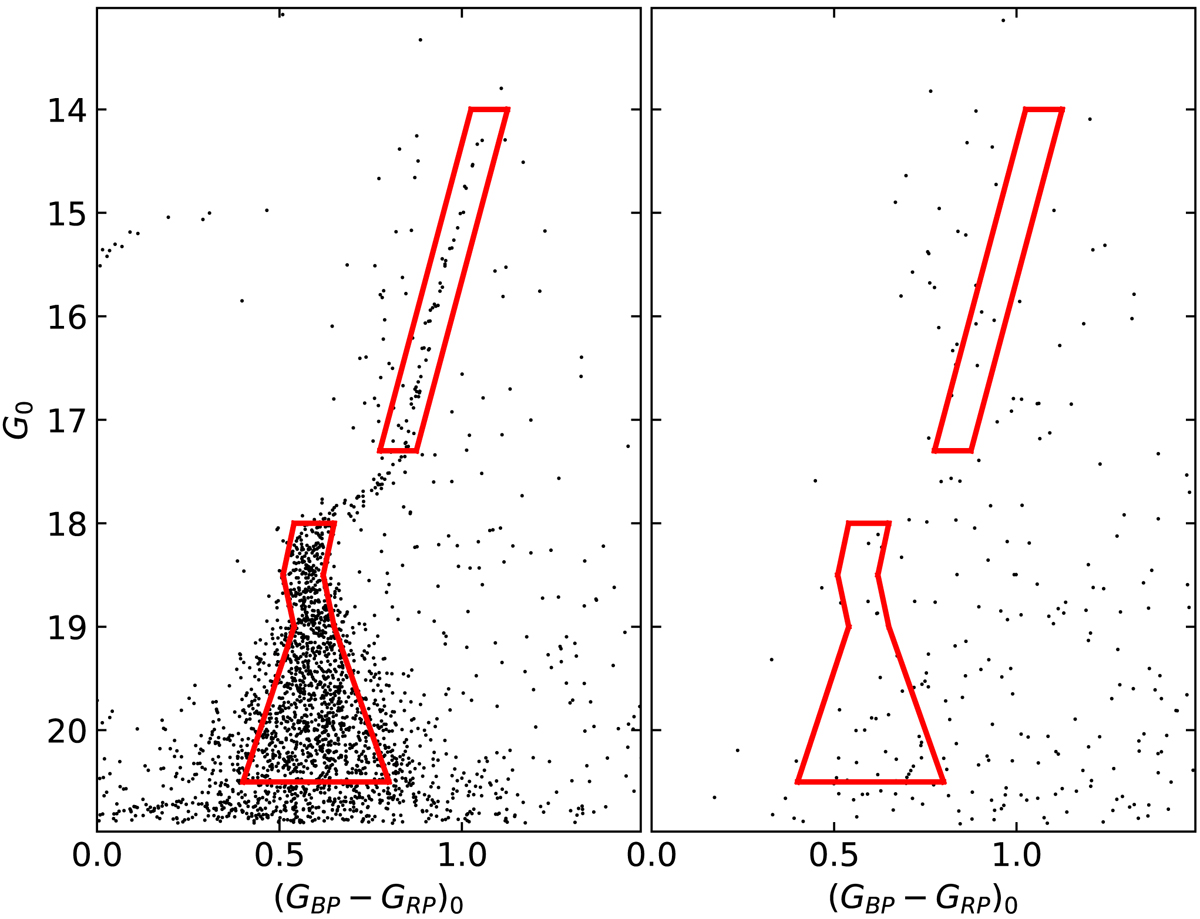
Gaia color–magnitude diagrams of stars in the field of NGC 7099 (r < 0.15°; left panel) and in an annular region of the same area centered on the cluster with an external radius of 0.8° (right panel). The RGB and MS regions used to perform star counts are delineated with red contour lines.
Current usage metrics show cumulative count of Article Views (full-text article views including HTML views, PDF and ePub downloads, according to the available data) and Abstracts Views on Vision4Press platform.
Data correspond to usage on the plateform after 2015. The current usage metrics is available 48-96 hours after online publication and is updated daily on week days.
Initial download of the metrics may take a while.