Fig. 3.
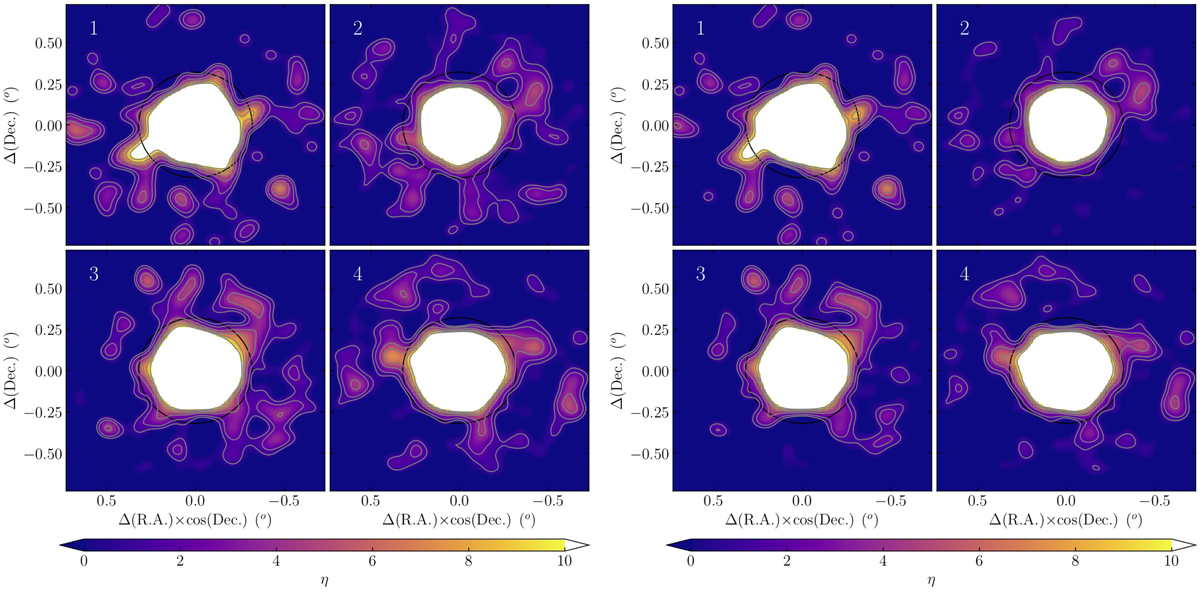
Observed (left panels) and field star cleaned (right panels) stellar density maps for the four MS strips of the cluster of Fig. 2 as labeled at the top-left margin of each panel. The black circle centered on the cluster indicates the assumed tidal radius. Contours for η = 1, 2, 4, 6, 8, and 10 are also shown; the colors follow the coding shown at the bottom of each panel.
Current usage metrics show cumulative count of Article Views (full-text article views including HTML views, PDF and ePub downloads, according to the available data) and Abstracts Views on Vision4Press platform.
Data correspond to usage on the plateform after 2015. The current usage metrics is available 48-96 hours after online publication and is updated daily on week days.
Initial download of the metrics may take a while.