Fig. 7.
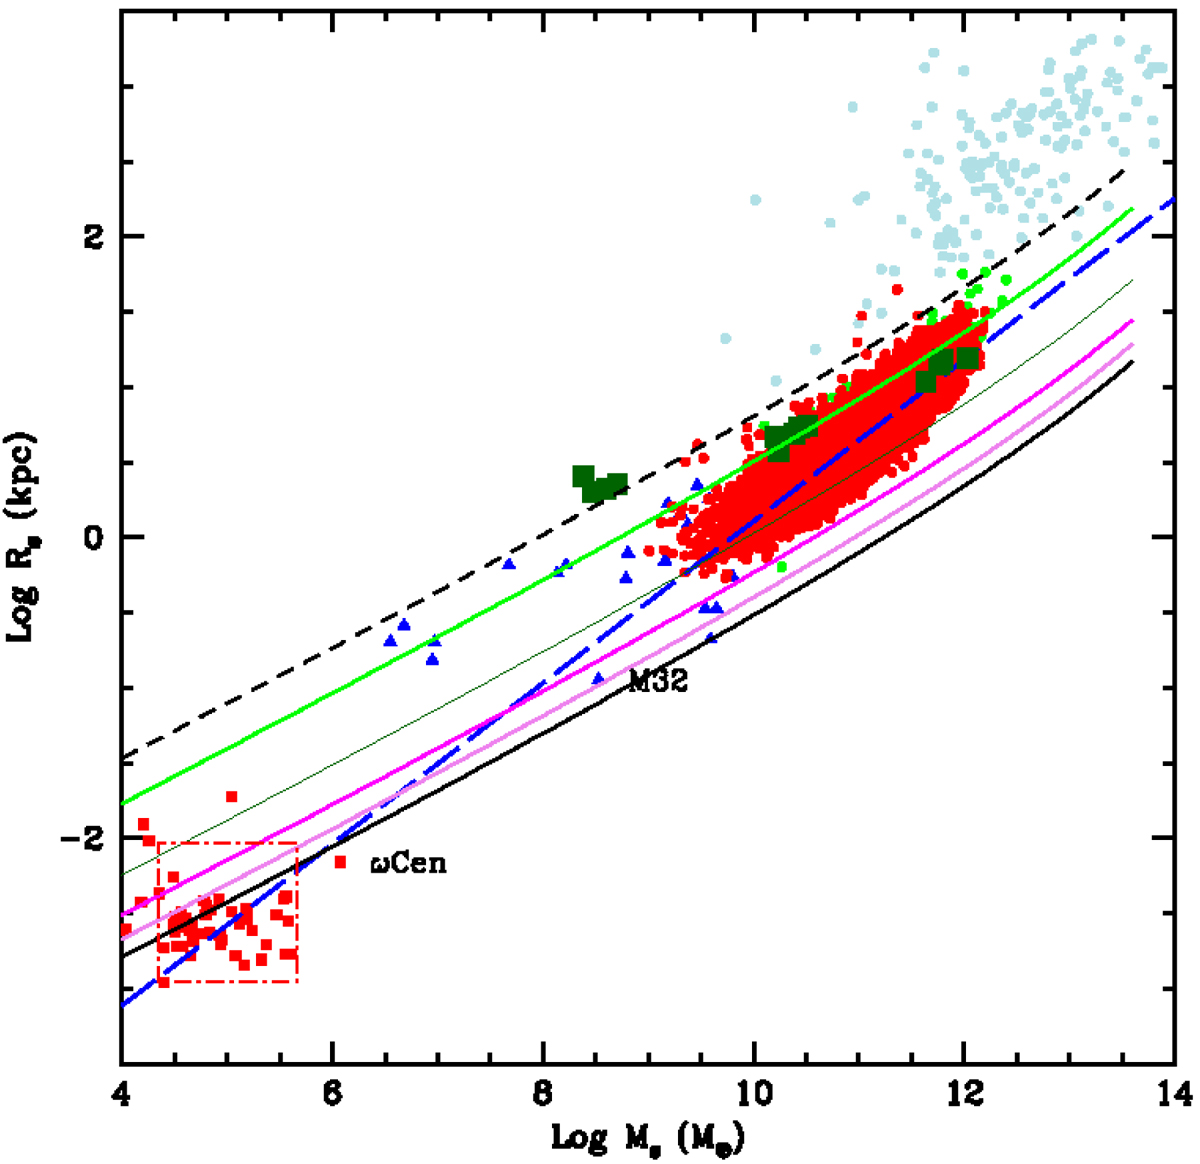
Comparison of the Fan et al. (2010) lines and the theoretical models by Merlin et al. (2012; green filled squares) with the observational data of Burstein et al. (1997) from GCs (small red squares), to DGs (small blue triangles), and GCGs (light blue filled circles) plus the ETGs of Bernardi et al. (2010; red dots). The short-dashed blue line is the Fan et al. (2010) relation for z = 0. The thin solid lines of different colours are the same relation but for z = 1, z = 5, z = 10, z = 15, and z = 20 from top to bottom in the order. The long-dashed, thick blue line is the best-fit of the ETGs of Bernardi et al. (2010) extended to GCs and GCGs.
Current usage metrics show cumulative count of Article Views (full-text article views including HTML views, PDF and ePub downloads, according to the available data) and Abstracts Views on Vision4Press platform.
Data correspond to usage on the plateform after 2015. The current usage metrics is available 48-96 hours after online publication and is updated daily on week days.
Initial download of the metrics may take a while.