Fig. 6.
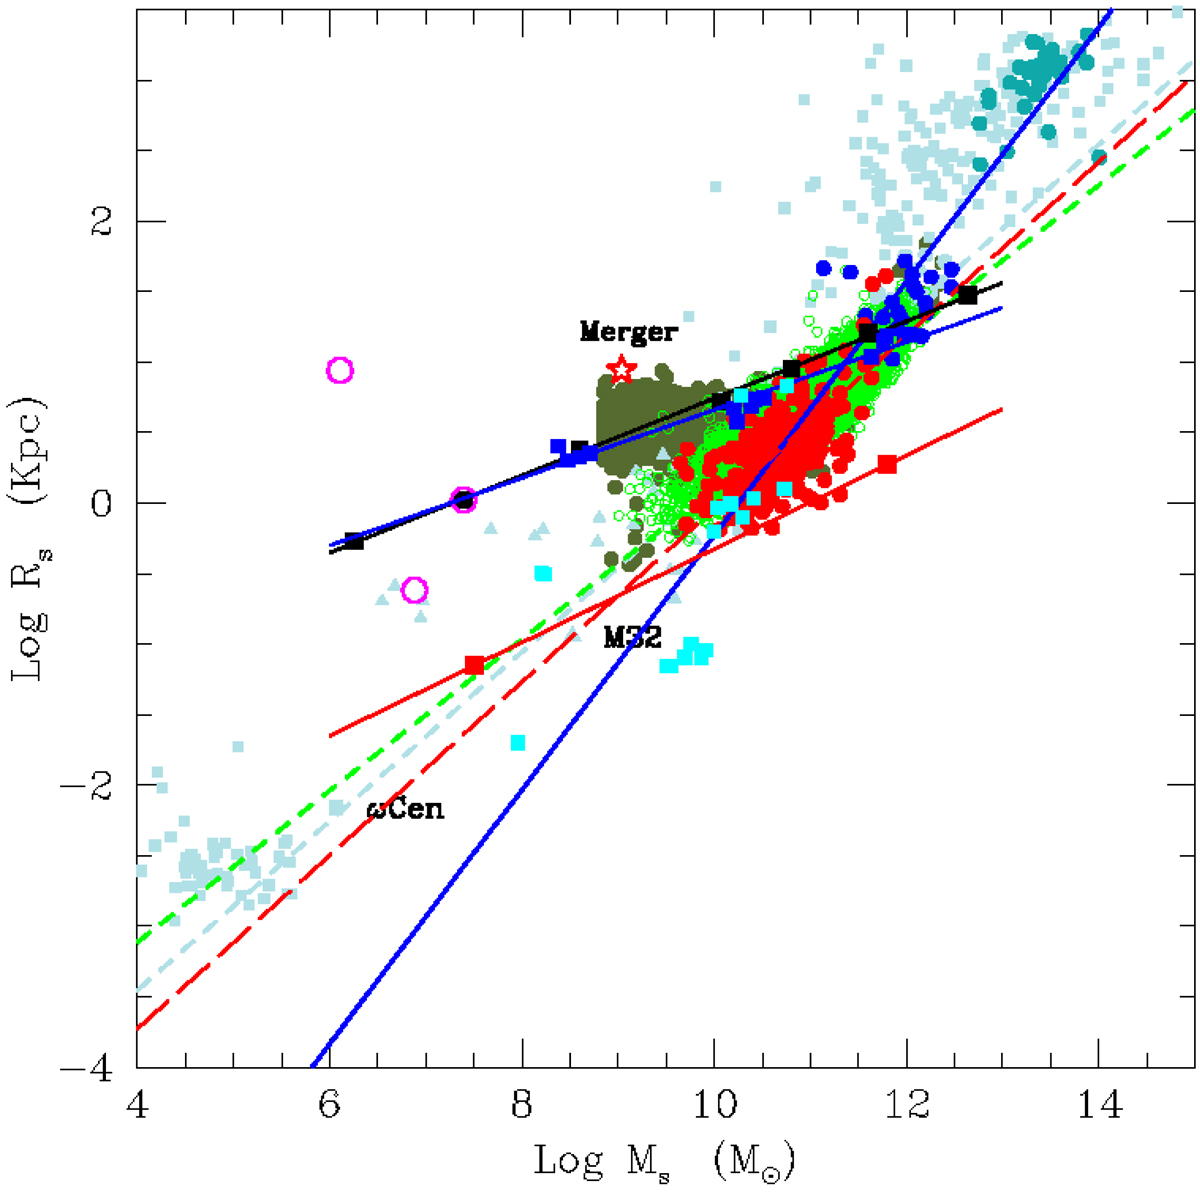
Composite Rs-versus-Ms relation and comparison between theory and observations. The light powder-blue dots are the data of Burstein et al. (1997) for ETGs, DGs, GCs, and GCGs, and the dashed line of the same colour is the best fit of the sole ETGs, this time extended to the domains of GCs and GCGs. The bright green dots are the Bernardi et al. (2010) data for ETGs, and the thick dashed line of the same colour is the best-fit line of these latter. The red, blue, and green-blue dots are the ETGs, BCGs, and GCGs of the WINGS sample. The dashed red line is the best-fit line of the ETGs, whereas the solid blue line is the best fit of all WINGS data lumped together. The slope of this latter line is very close to the MRR for virialised objects. In this case the line fails to hit the region of GCs. Finally, we display different theoretical models for comparison. The black filled squares connected by the black solid line and the red squares connected by the solid red line are the monolithic models by Chiosi & Carraro (2002) and their linear fit. The two groups of models differ for the density of the Universe (redshift) at initial collapse. The three coral open circles are low-mass ETGs with the same mass but slightly different initial densities by Chiosi & Carraro (2002); see the data of Table B.2. The empty red star is the merger reported by Chiosi & Carraro (2002). The blue squares connected by the blue line are the hierarchical models by Merlin et al. (2010, 2012); see Table B.3 for more details. The light blue-green squares are the ancillary model of Chiosi et al. (2012); see Table B.3. Finally, the dark olive-green points are the reference model galaxies of the Illustris simulations.
Current usage metrics show cumulative count of Article Views (full-text article views including HTML views, PDF and ePub downloads, according to the available data) and Abstracts Views on Vision4Press platform.
Data correspond to usage on the plateform after 2015. The current usage metrics is available 48-96 hours after online publication and is updated daily on week days.
Initial download of the metrics may take a while.