Fig. A.1.
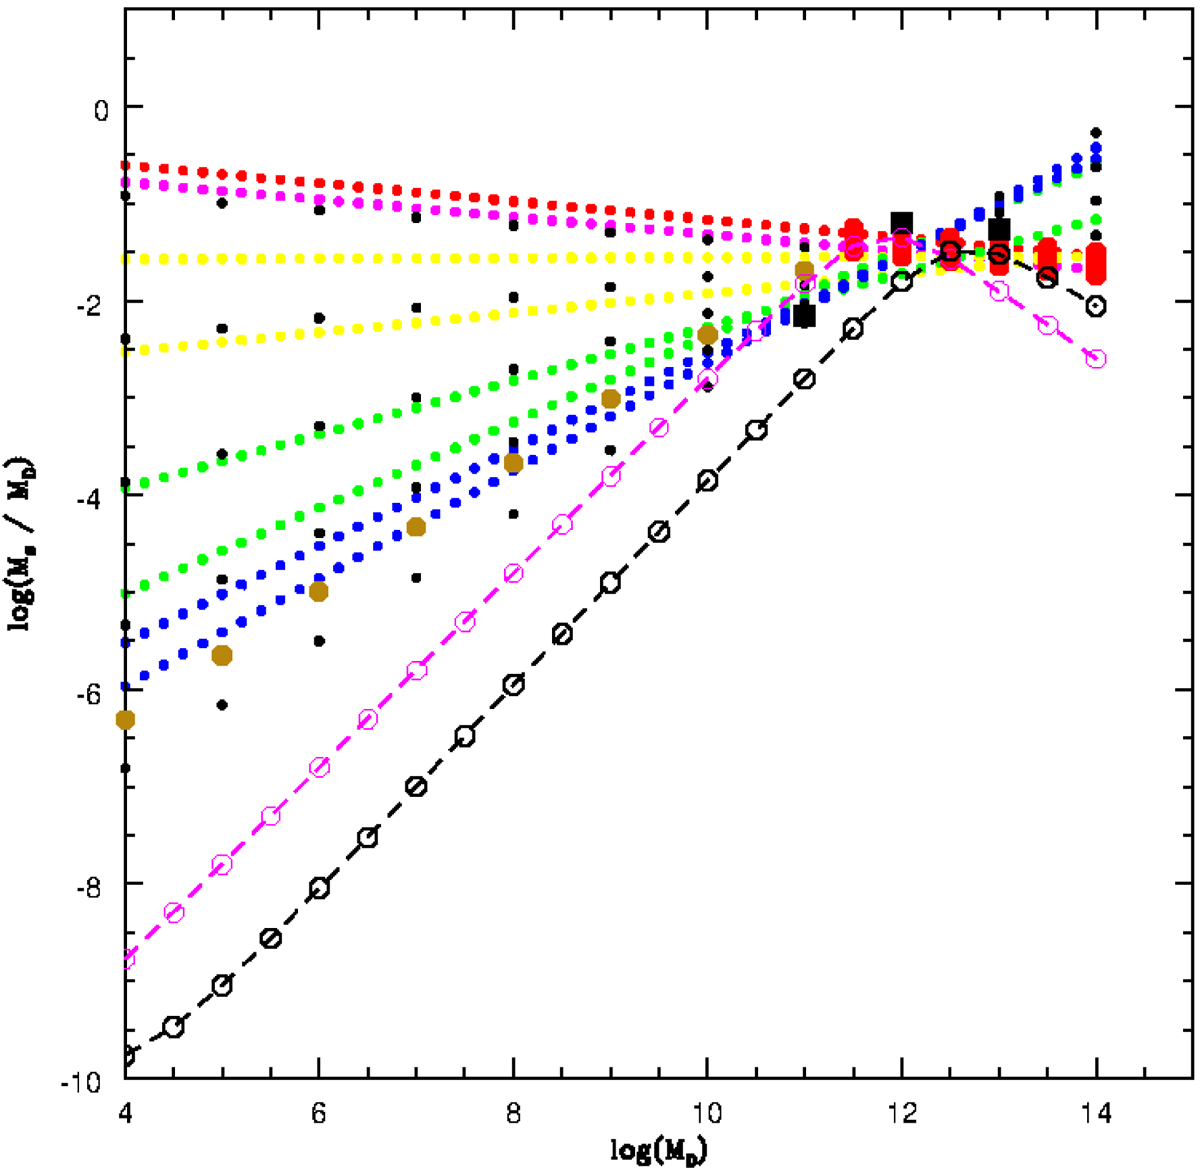
Relations Ms/MDMD at different redshifts for theoretical models (all masses are in solar units). The dotted lines of different colours correspond to the eight values of the redshift z = 0 and z = 0.2 (top, red), z = 0.6, z = 1.0 (intermediate, yellow), z = 1.6 and z = 2.2 (intermediate, green), z = 3 and to z = 4 (bottom, blue). The black dots are the values predicted by Eq. (A.1) at varying log MD from 4 to 14 in steps of 1 and redshift z from 0 to 4 in steps of 1, respectively. The large red and golden circles are the combination of Eqs. (A.3) and (A.2), respectively. The open magenta (z = 0) and black (z = 3.95) circles are relation Ms/MD vs. MD at different redshifts according to Girelli et al. (2020). We note how all relations agree with each other at log MD ≃ 12 whereas they badly disagree at lower values of MD.
Current usage metrics show cumulative count of Article Views (full-text article views including HTML views, PDF and ePub downloads, according to the available data) and Abstracts Views on Vision4Press platform.
Data correspond to usage on the plateform after 2015. The current usage metrics is available 48-96 hours after online publication and is updated daily on week days.
Initial download of the metrics may take a while.