Fig. 11.
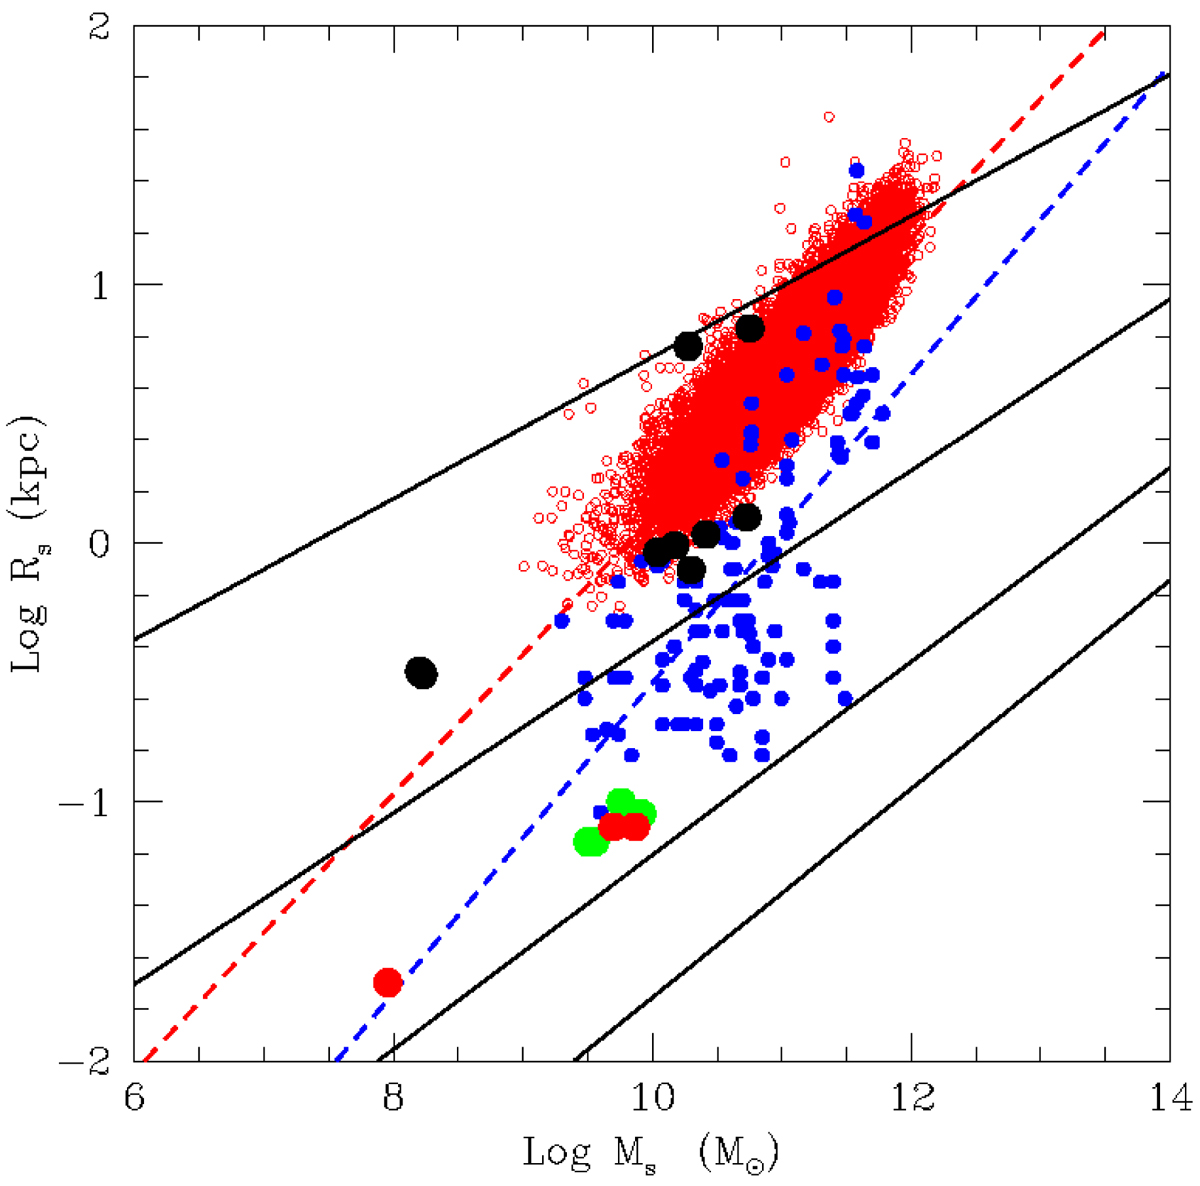
log[Rs] vs. log[Ms] relation for compact galaxies (filled blue circles) and their best fit (blue dashed line). The red open circles are the ETGs from Bernardi et al. (2010) plotted here for comparison, and the red dashed line is their best-fit. The large filled circles are the 12 ancillary models (black the efficiency of star formation ϵsff = 1, green for ϵsff = 0.5, and red for ϵsff = 0.1). The thin straight lines are the present-day MRRs of model galaxies that started their collapse at different redshifts, namely zf = 1, zf = 5, zf = 8, and zf = 10 from top to bottom. The lines are given by Eq. (34).
Current usage metrics show cumulative count of Article Views (full-text article views including HTML views, PDF and ePub downloads, according to the available data) and Abstracts Views on Vision4Press platform.
Data correspond to usage on the plateform after 2015. The current usage metrics is available 48-96 hours after online publication and is updated daily on week days.
Initial download of the metrics may take a while.