Fig. 10.
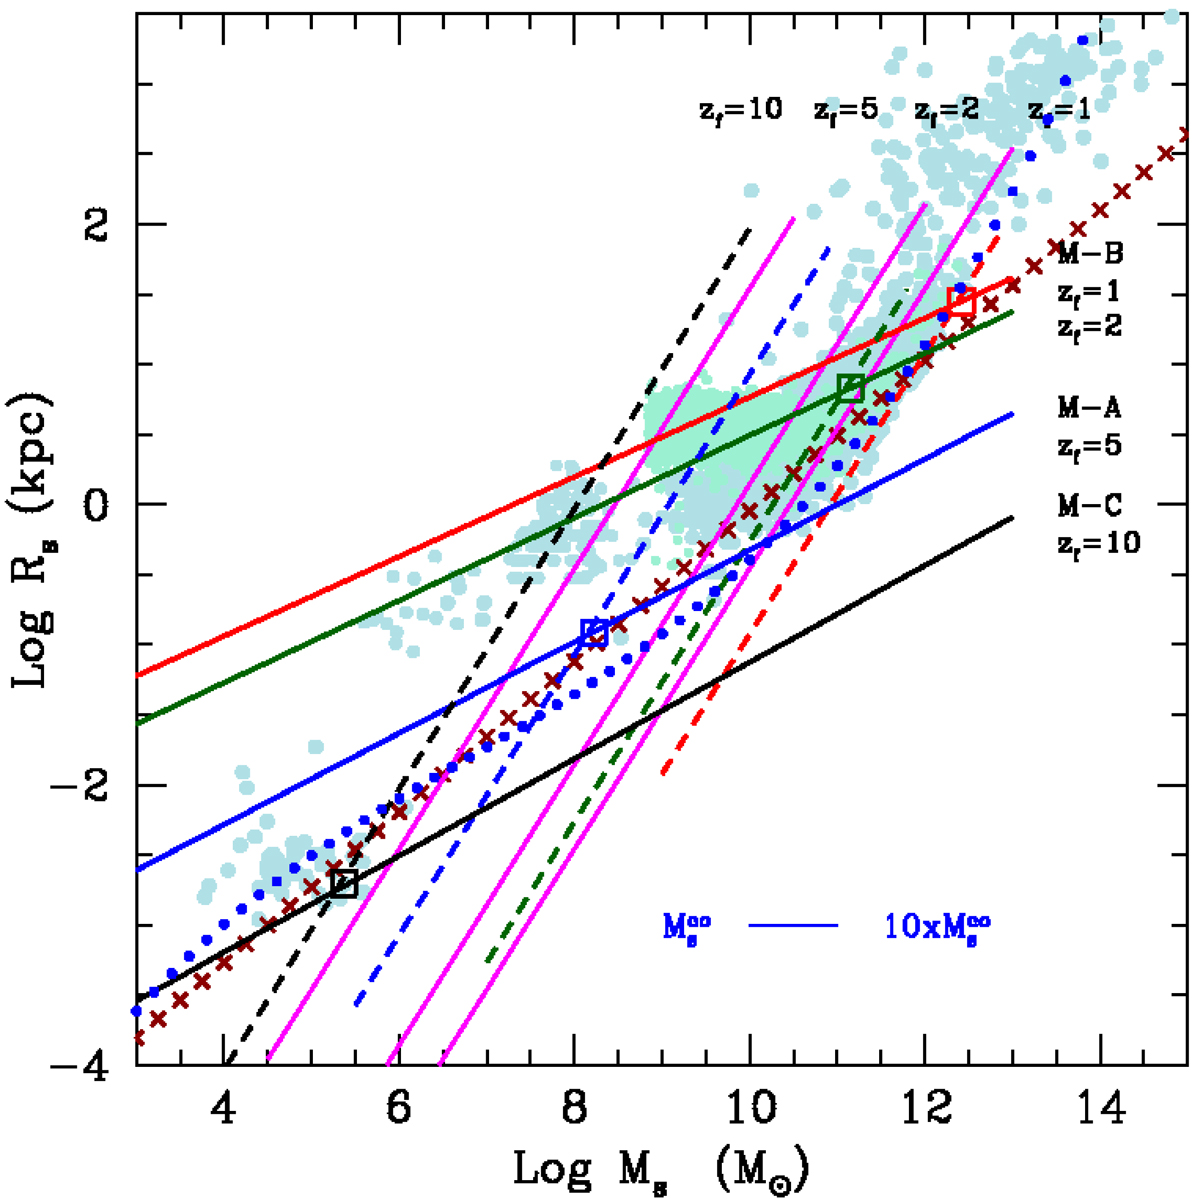
Mass-radius relationship: comparison between data and theory. Radii Rs and stellar masses Ms are in kiloparsecs and M⊙, respectively. The pale-blue filled circles are all the data considered in this study, and the pale green filled circles are the models of Illustris. The dark-red thick crossed line is the linear best fit of normal ETGs (MT ≥ 1010 M⊙) given by Eq. (3), but prolonged down to the region of GCs and upwards to that of GCGs. The four solid dashed line labelled Mod-A (zf = 5, blue), Mod-B (zf = 1, red and zf = 2, dark green), and Mod-C (zf = 10 black) are the analytical relationships of Eq. (34) showing the loci of galaxy models with different mass but constant initial density for different values of redshift of galaxy formation zf as indicated. These lines are the best fit of the models by Chiosi & Carraro (2002), Merlin et al. (2012), and Chiosi et al. (2012); see Tables B.1–B.3. The magenta solid lines show the virial condition on the MR plane for different velocity dispersion (50, 250 500 km s−1 from left to right). The dashed black lines labeled by different values of zf are the MRRs expected for galaxies with total mass equal to 50 × MCO(z), the cut-off mass of the Press-Schechter at varying zf according to relation (35). These lines go in pairs with the best-fit lines of models of identical initial density labelled with the same colour. The large empty squares illustrate the intersections between the lines of constant initial density and the MRRs for 50 × Mco galaxies for equal redshift. All the intersections lie very close to the relation of Eq. (3) shown by the dark-red crossed line. This is the linear interpretation of the observed MRR, i.e. the analytical demonstration of Sect. 5. Finally, the curved blue dotted line shows the expected MRR for the baryonic component of DM halos whose mass distribution follows the cosmological HGF by Lukić et al. (2007). The curve has been extended to include the GCs and the GCGs (see main text for more details). We highlight the ever changing slope of the MRR which decreases passing from GCGs to ETGS and GCs. Remarkably, the curved line first runs very close to the large empty squares, and then secondly to a linear fit of the data (crossed line), and third accounts for the observed MRR passing from GCs to GCGs (about ten orders of magnitude difference in star mass). The horizontal blue line shows the interval for Ms corresponding to initial masses MCO(z) < MT < 10 × MCO(z) (the percentage of galaxies in this interval amounts to ≃15%), which highlights the fact that at each redshift the high-mass edge of the MRR has a natural width.
Current usage metrics show cumulative count of Article Views (full-text article views including HTML views, PDF and ePub downloads, according to the available data) and Abstracts Views on Vision4Press platform.
Data correspond to usage on the plateform after 2015. The current usage metrics is available 48-96 hours after online publication and is updated daily on week days.
Initial download of the metrics may take a while.