Fig. 1.
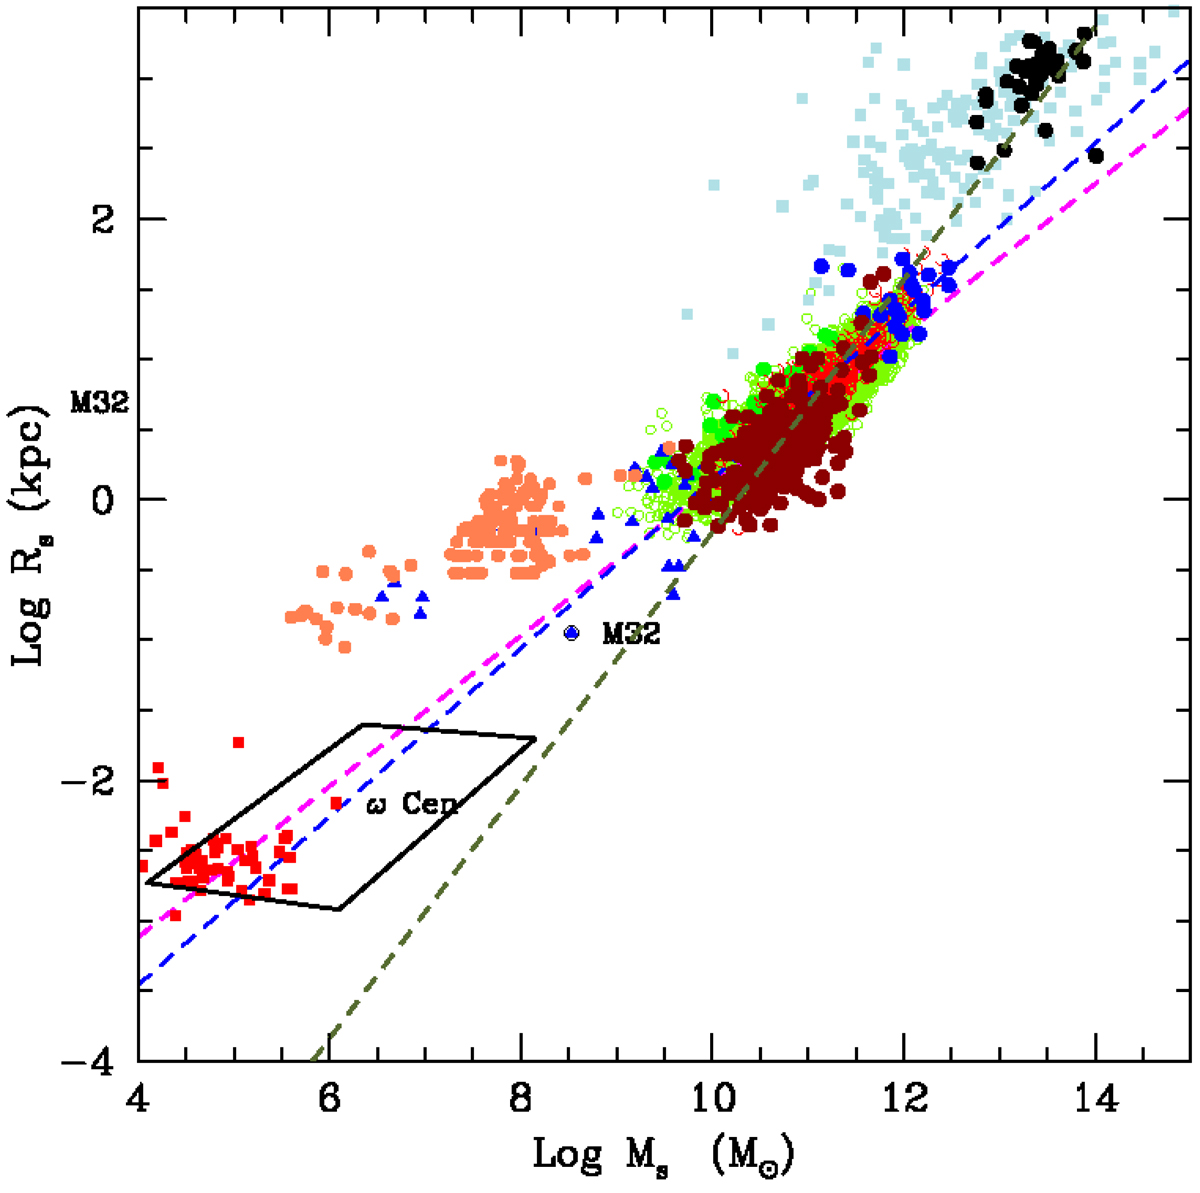
log(Rs) vs. log(Ms) relation for all the samples under consideration. Rs is the half-mass radius and Ms the total stellar mass. Although Rs is not strictly identical to the effective radius Re, they are very close to each other. Throughout this paper we always use Rs, which is easier to calculate for hydrodynamic models of galaxies, and assume Rs ≃ Re. Burstein et al. (1997) sample: filled red circles are the ETGs, green open circles the SGs, blue filled triangles the DGs, filled red squares the GCs, and filled light-blue squares are the GCGs. The blue dashed line is the linear best fit of Eq. (2), i.e. log Rs = 0.60 log Ms − 5.859 relative to the sole ETGs, but extended to the regions of GCs and GCGs. Bernardi et al. (2010) sample: only ETGs are present, indicated by green filled circles. They fully overlap the ETGs of Burstein et al. (1997). The dashed magenta line is the linear best fit of the ETG data, but extended to GCs and GCGs. WINGS sample: dark-red filled circles are the ETGs, blue filled circles the BCGs, and the black filled circles are the GCGs. The olive-green dashed line is the linear best-fit of all WINGS objects together log Rs = 0.901log Ms − 9.245, but extended to DGs and GCs. Dwarf galaxies and Globular Clusters: coral filled circles are the DGs of Woo et al. (2008) and Geha et al. (2006) all together. Finally, the parallelogram shows the area occupied by the transition objects from GCs to DGs of Kissler-Patig et al. (2006).
Current usage metrics show cumulative count of Article Views (full-text article views including HTML views, PDF and ePub downloads, according to the available data) and Abstracts Views on Vision4Press platform.
Data correspond to usage on the plateform after 2015. The current usage metrics is available 48-96 hours after online publication and is updated daily on week days.
Initial download of the metrics may take a while.