Fig. 3
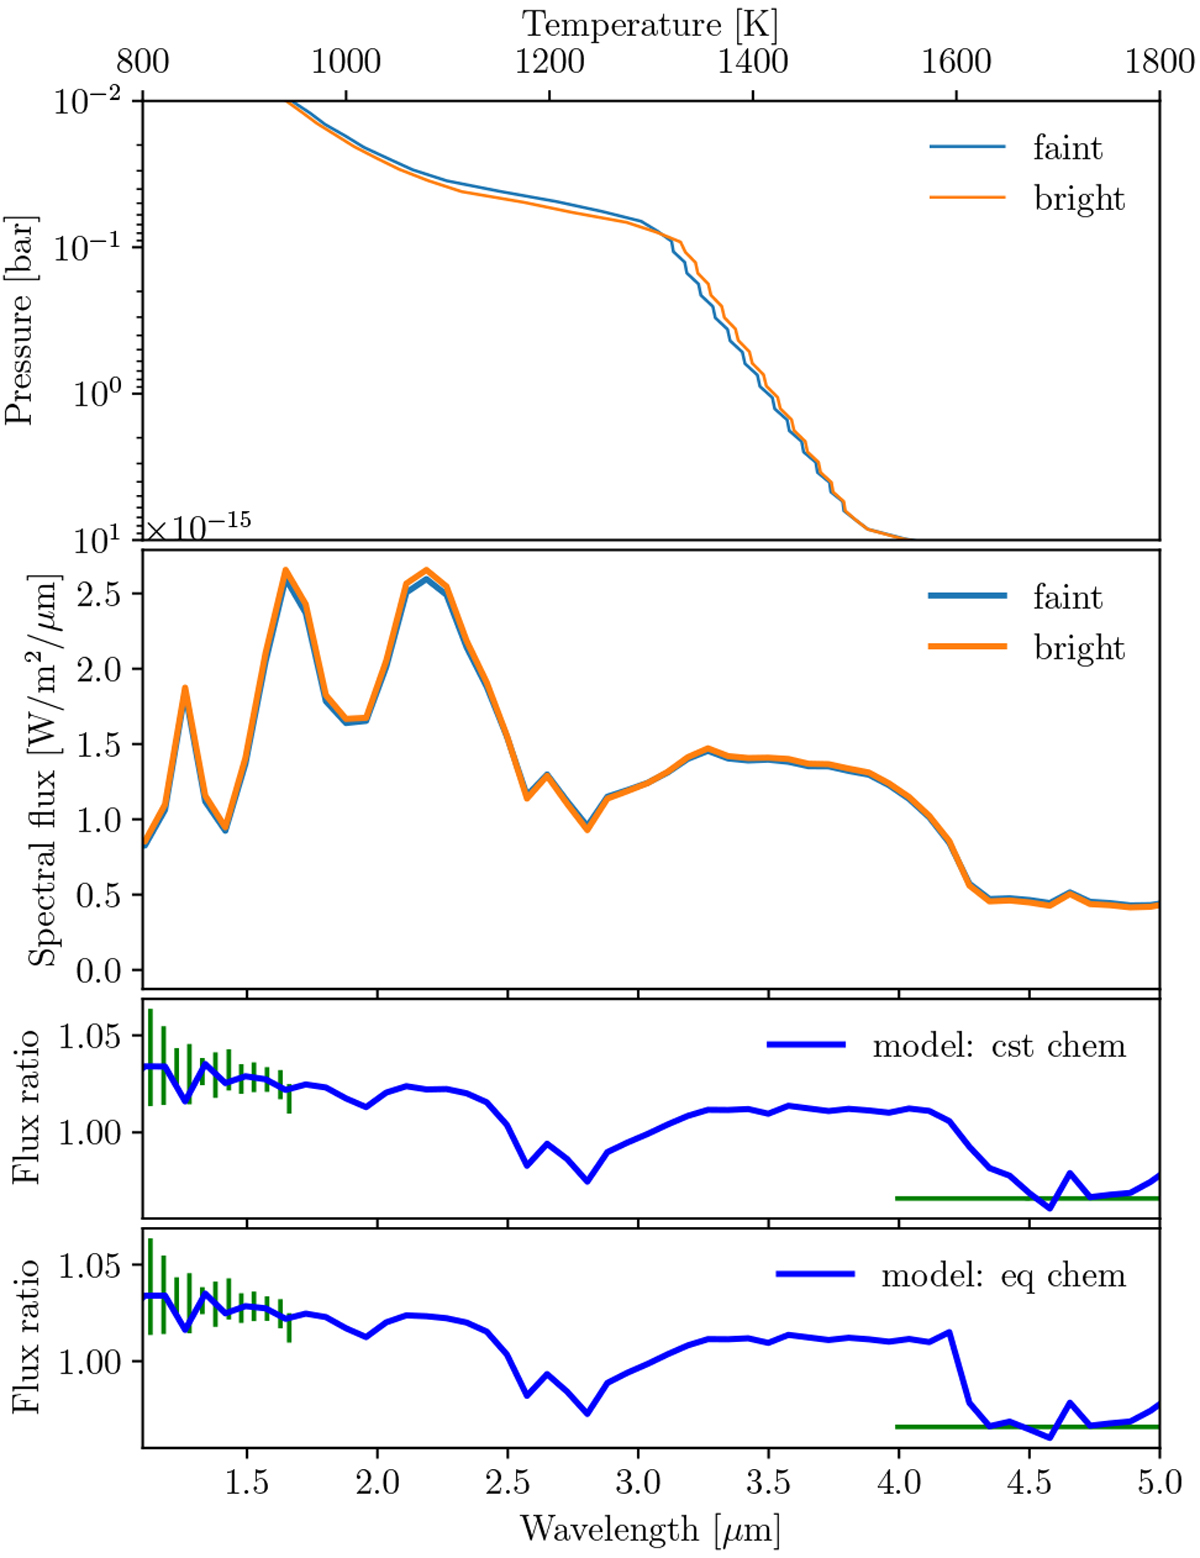
Model of PSO 318.5-22. Top: PT structures, red is the bright state, blue is the faint state. Middle: spectral flux at a resolution R ~ 25, red is the bright state, blue is the faint state. Bottom: modeled spectral ratio in blue either assuming chemical abundances in the bright state equal to the abundances in the faint state or assuming chemical equlibrium. The observed spectral ratio is in green (see Biller et al. 2018, for details).
Current usage metrics show cumulative count of Article Views (full-text article views including HTML views, PDF and ePub downloads, according to the available data) and Abstracts Views on Vision4Press platform.
Data correspond to usage on the plateform after 2015. The current usage metrics is available 48-96 hours after online publication and is updated daily on week days.
Initial download of the metrics may take a while.