Fig. 2
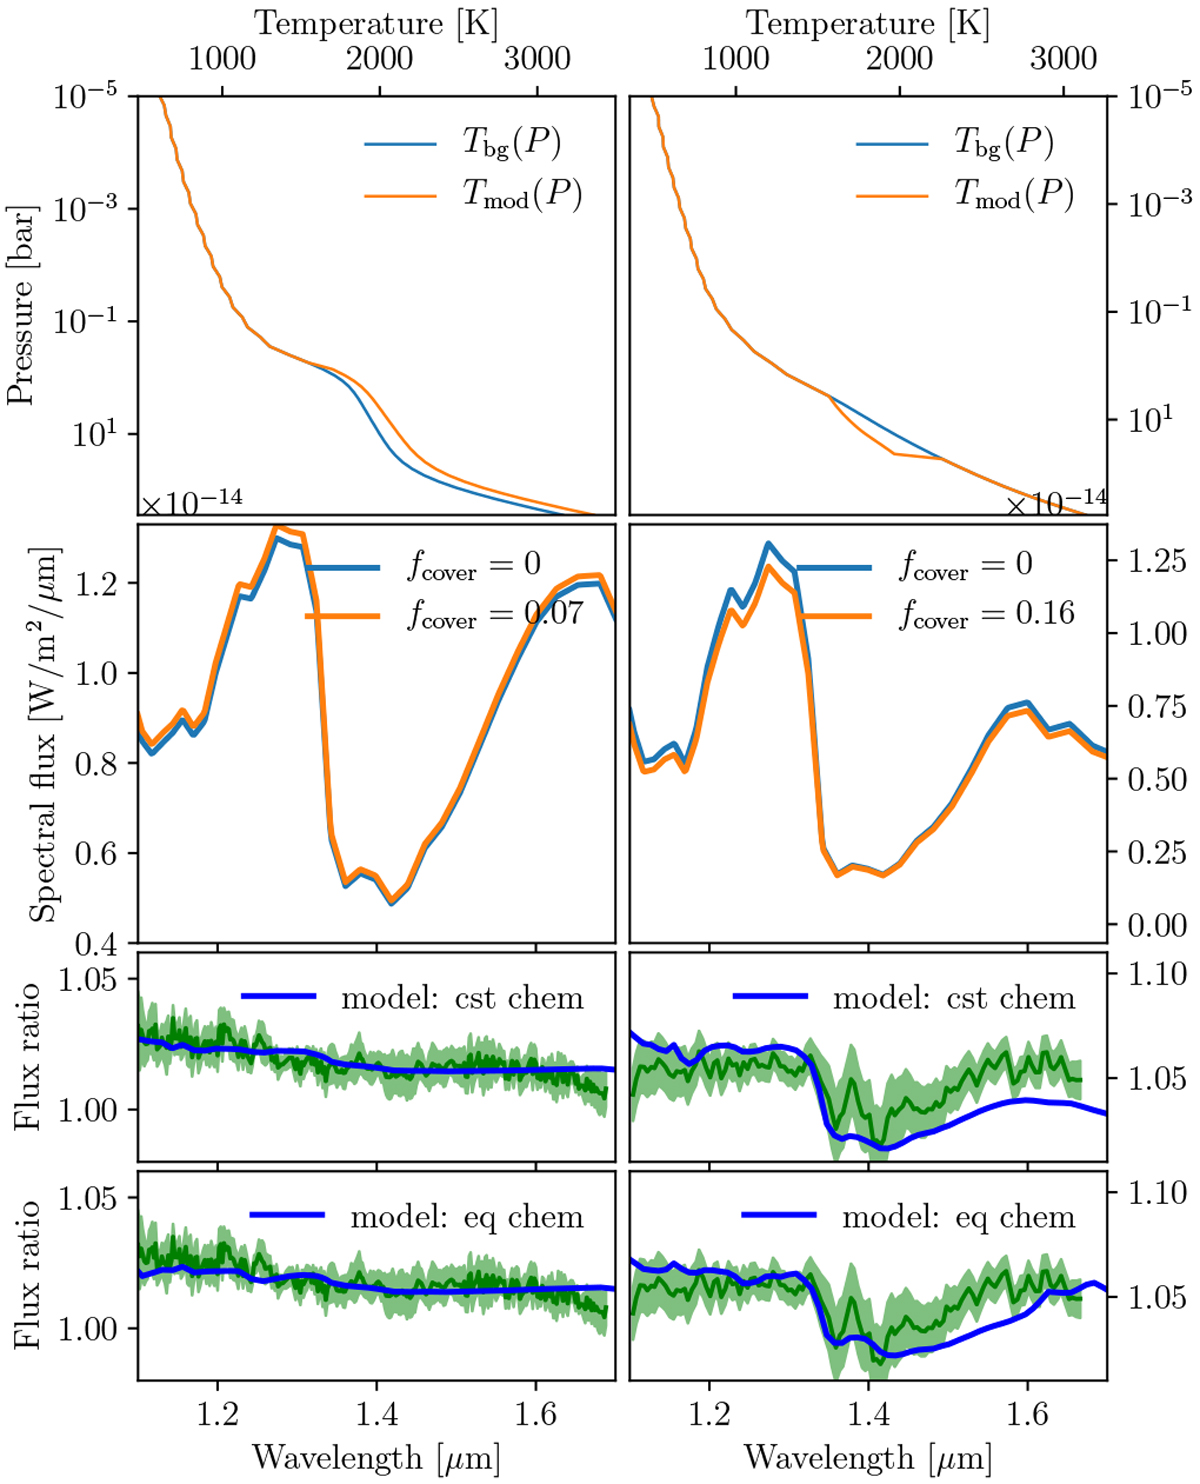
Left: 2M 1821 (L dwarf), right: 2M 0136 (T dwarf). Top: PT profiles, blue is the background profile and red is the modulation PT profile. Middle: spectral flux at a resolution R ~ 100, blue is the spectral flux computed with the background PT profile, red is the spectral flux computed with Eq. (2). Bottom: modeled spectral bright-to-faint ratio in blue assuming either equilibrium chemistry in the modulation or constant abundances equal to the background values. Observed spectral ratio is in green (Yang et al. 2015).
Current usage metrics show cumulative count of Article Views (full-text article views including HTML views, PDF and ePub downloads, according to the available data) and Abstracts Views on Vision4Press platform.
Data correspond to usage on the plateform after 2015. The current usage metrics is available 48-96 hours after online publication and is updated daily on week days.
Initial download of the metrics may take a while.