Fig. 5.
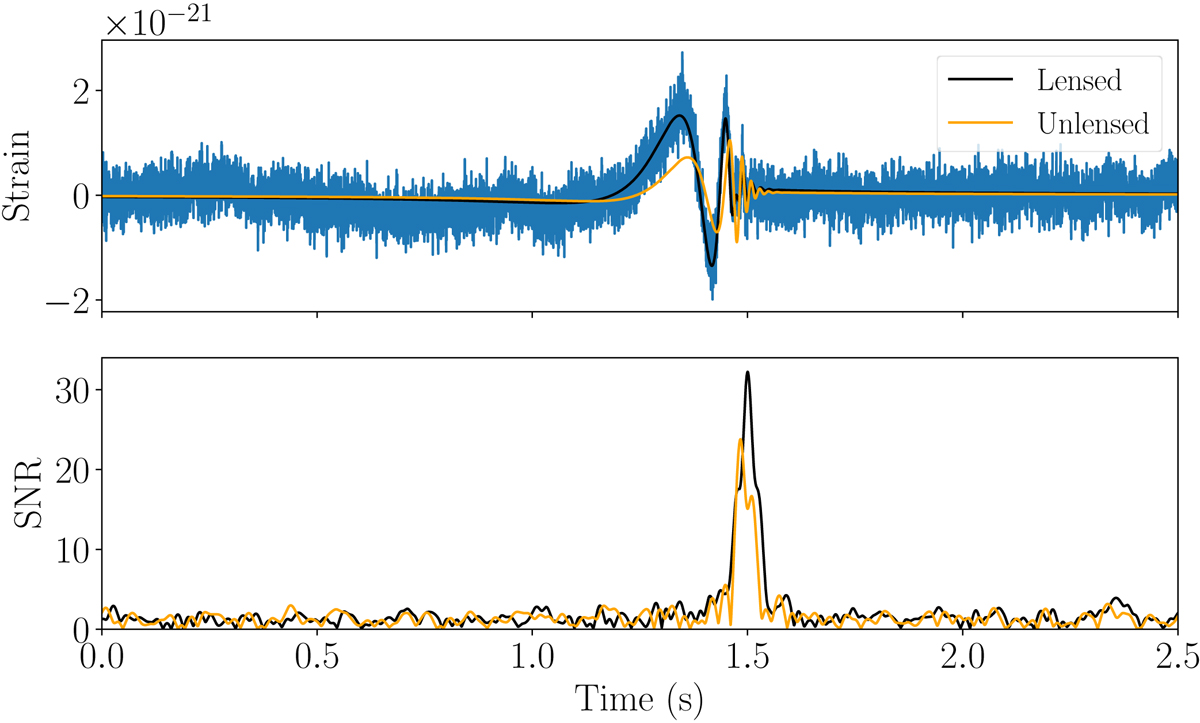
Matched filtering with lensed and unlensed waveforms. Top panel: example microlensed gravitational-wave strain (black line) and corresponding detector data with noise (blue data). The unlensed strain is also shown for comparison (orange line). Bottom panel: matched filter S/N of the detector data using the microlensed waveform (black line) and the unlensed waveform (orange line). The microlensed gravitational-wave strain matches the data better and thus returns a higher matched S/N. Here, a high S/N example is considered for illustration, and both signals are normalized so that their optimal S/Ns are the same.
Current usage metrics show cumulative count of Article Views (full-text article views including HTML views, PDF and ePub downloads, according to the available data) and Abstracts Views on Vision4Press platform.
Data correspond to usage on the plateform after 2015. The current usage metrics is available 48-96 hours after online publication and is updated daily on week days.
Initial download of the metrics may take a while.