Fig. 8.
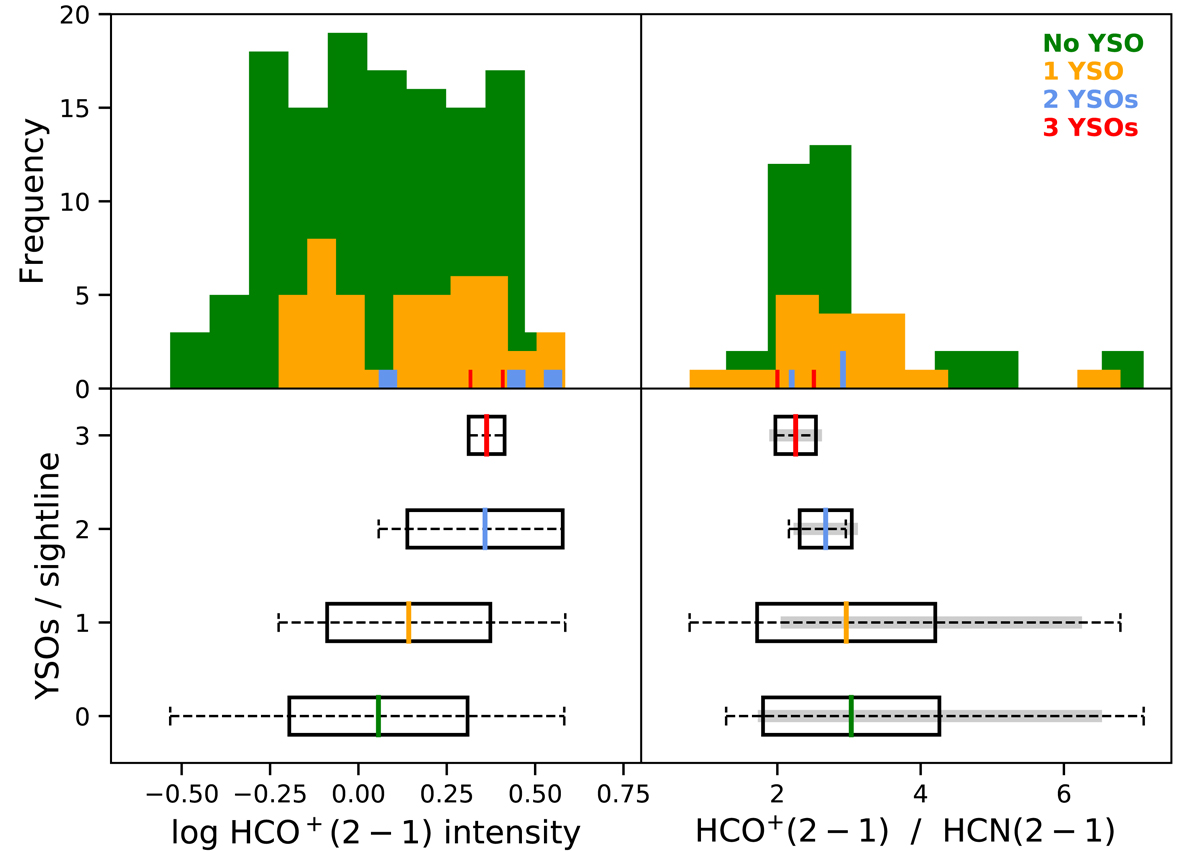
Top: histograms of the HCO+(2−1) integrated intensities in K km s−1 (left) and HCO+(2−1)/HCN(2−1) integrated intensity ratios (right) of all the LOSs observed. LOSs with 0, 1, 2, and 3 YSOs are shown in green, orange, blue, and red, respectively. Bottom: characteristics of each of these distributions. The black box indicates the standard deviation, the colored line the mean value, and the dashed line indicates the minimum and maximum HCO+(2−1) intensity (left) or HCO+(2−1)/HCN(2−1) (right) for each distribution. The gray thick line indicates the standard deviation of the distribution when LOSs that have HCO+ detection and HCN upper limits are included.
Current usage metrics show cumulative count of Article Views (full-text article views including HTML views, PDF and ePub downloads, according to the available data) and Abstracts Views on Vision4Press platform.
Data correspond to usage on the plateform after 2015. The current usage metrics is available 48-96 hours after online publication and is updated daily on week days.
Initial download of the metrics may take a while.