Open Access
Fig. A.1.
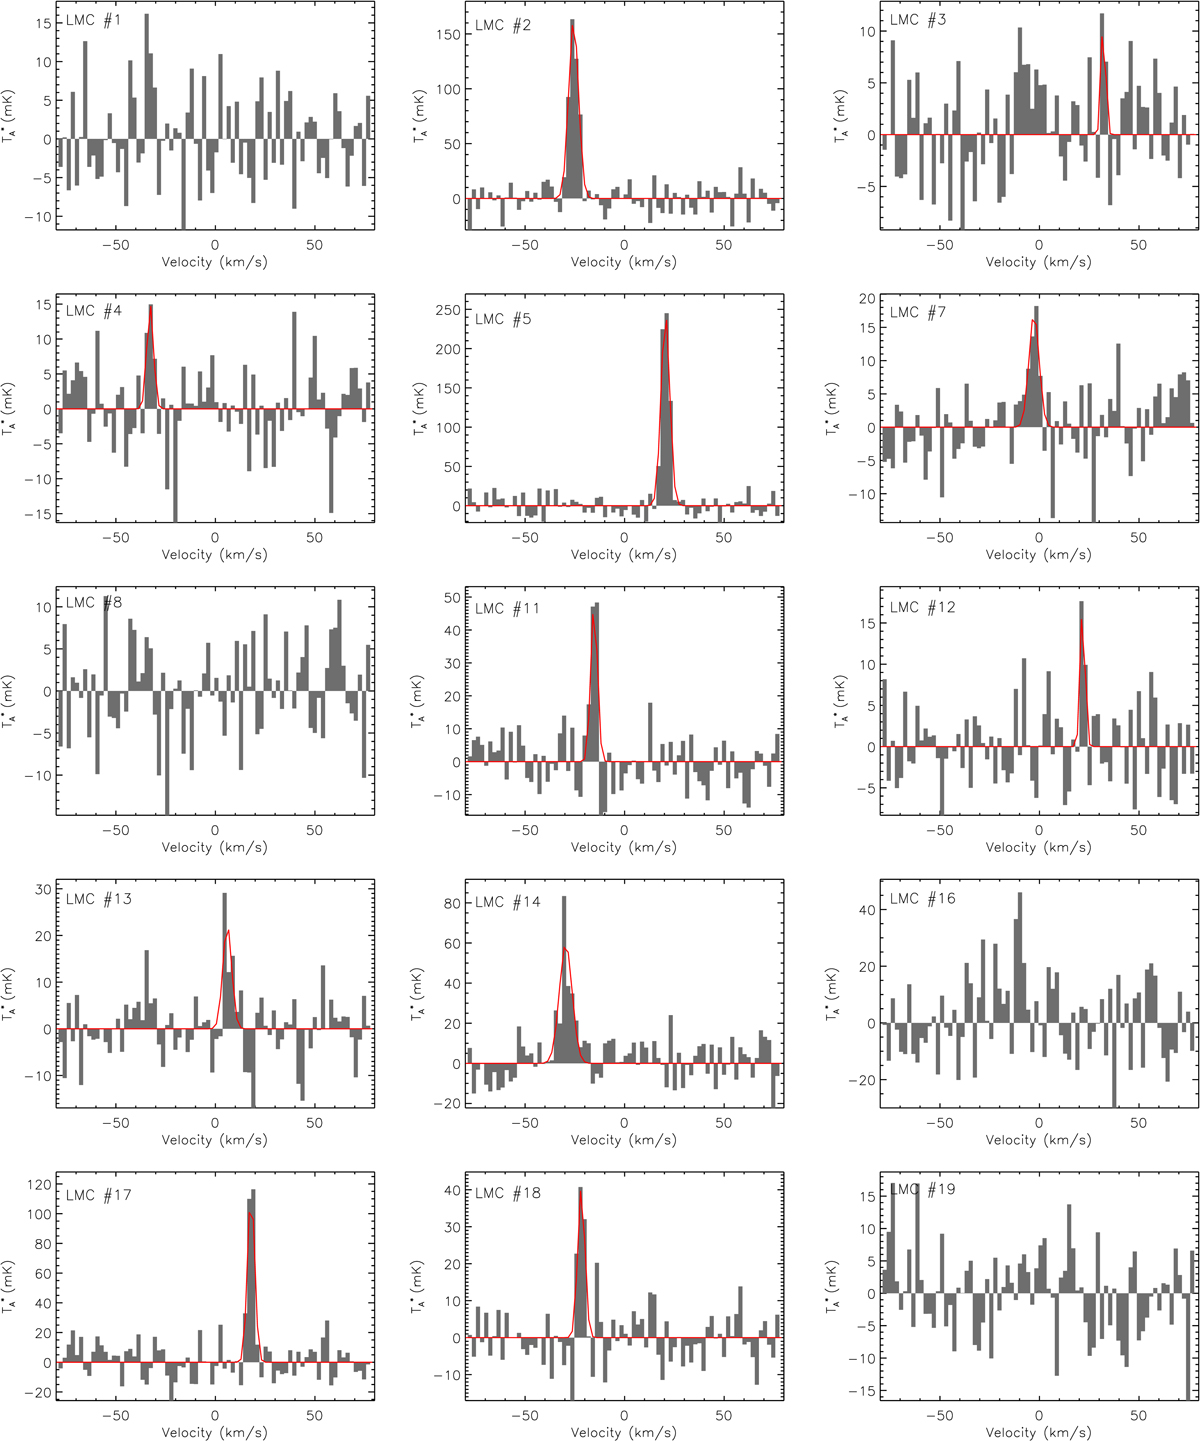
HCO+(2−1) observations toward the LMC and SMC (2 km s−1 spectral resolution). The bottom x-axis is expressed in velocity with respect to the systemic velocity (v = 0 corresponding to 262.2 km s−1 for the LMC and 158 km s−1 for the SMC). We indicate with a red line the Gaussian fit on the lines detected at a 3-σ level.
Current usage metrics show cumulative count of Article Views (full-text article views including HTML views, PDF and ePub downloads, according to the available data) and Abstracts Views on Vision4Press platform.
Data correspond to usage on the plateform after 2015. The current usage metrics is available 48-96 hours after online publication and is updated daily on week days.
Initial download of the metrics may take a while.