Fig. A.1
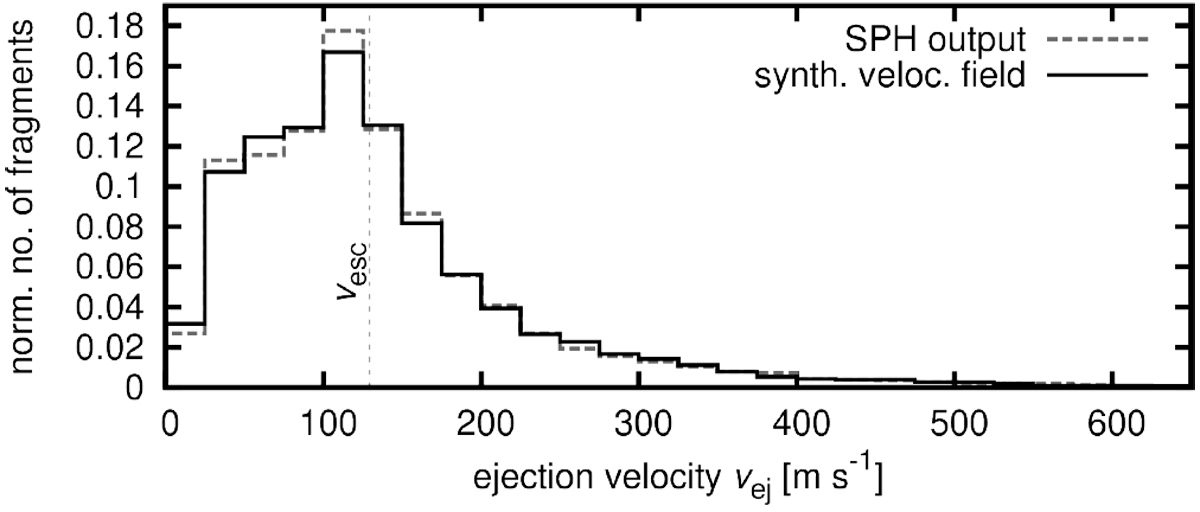
Histogram of ejection velocities vej used to generate initial orbits of test particles in our N-body simulation (solid line). The distribution was calculated by generating vej pseudo-randomly from an ejection velocity field of an SPH simulation (dashed line; see also Fig. 9). For reference, the dotted vertical line shows the escape velocity vesc from (31) Euphrosyne.
Current usage metrics show cumulative count of Article Views (full-text article views including HTML views, PDF and ePub downloads, according to the available data) and Abstracts Views on Vision4Press platform.
Data correspond to usage on the plateform after 2015. The current usage metrics is available 48-96 hours after online publication and is updated daily on week days.
Initial download of the metrics may take a while.