Fig. 11
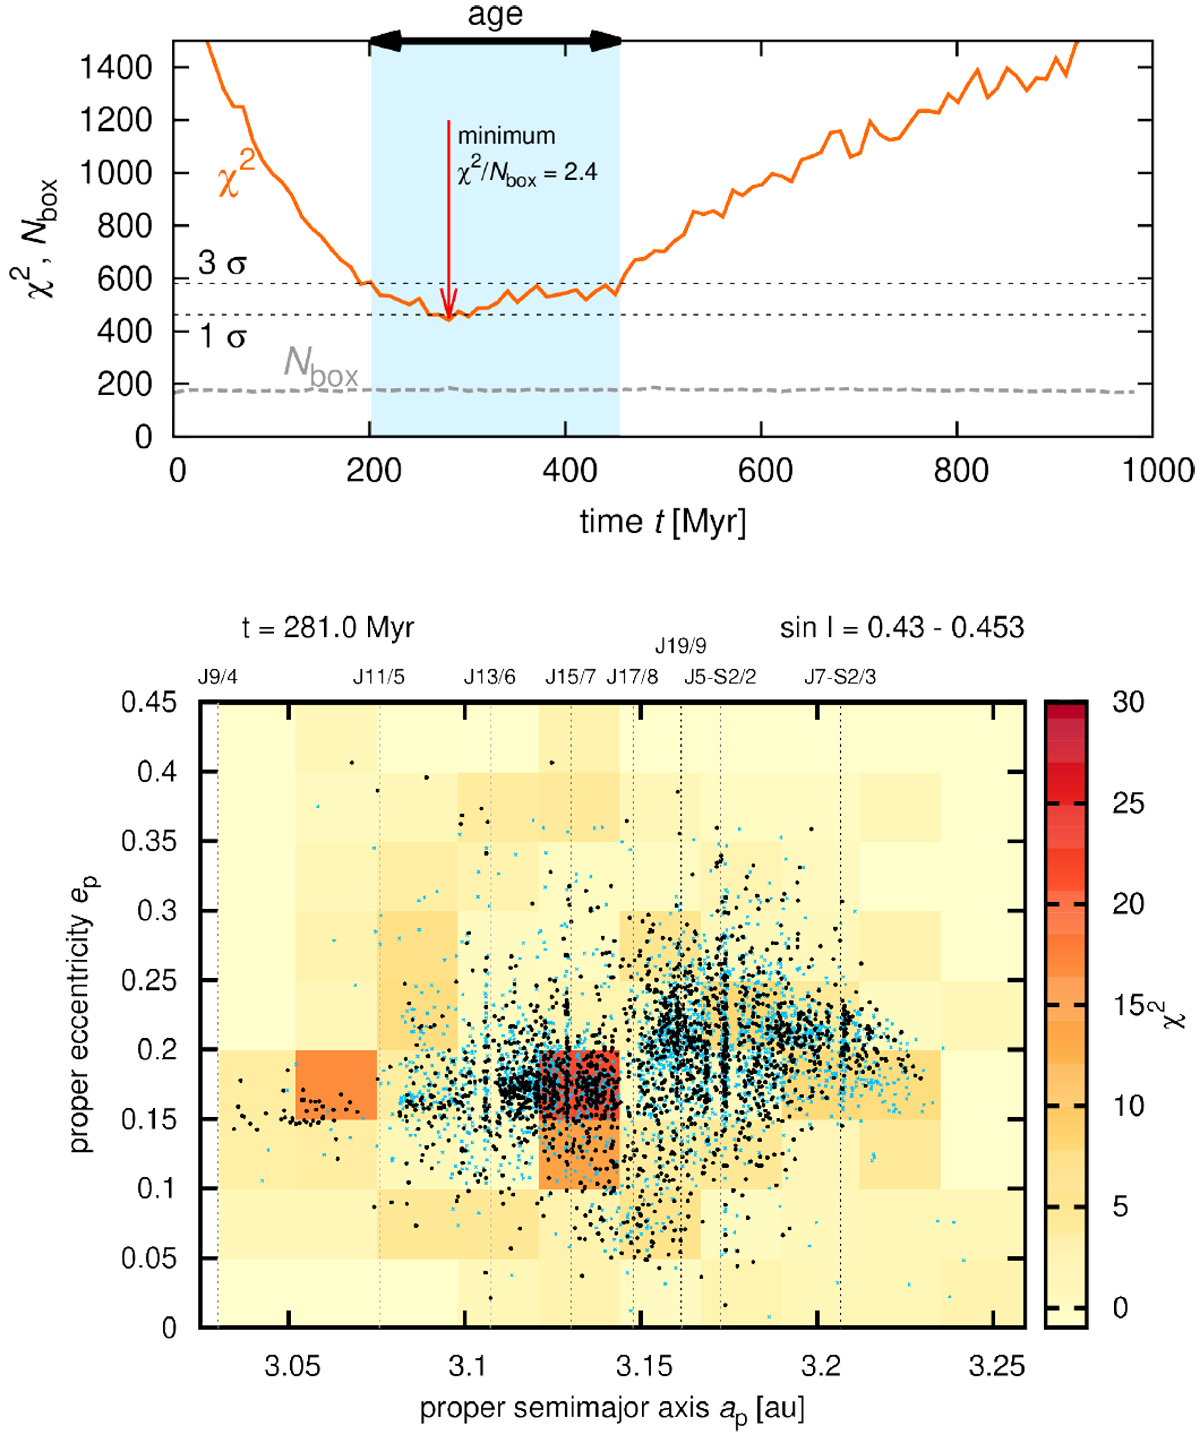
Top: χ2 metric (orange curve) as a function of the simulation time t. The thick dashed line shows the evolution of Nbox, and the thin dashed lines are 1-σ and 3- σ confidence levels, the latter of which determines the interval of relevant ages of the family (light blue rectangle). The minimal ratio χ2∕Nbox is attained at t = 281 Myr. Bottom: a box-by-box map of the χ2 values at t = 281 Myr. The displayed (ap, ep) plane corresponds to the inclination range sinip ∈ (0.43;0.453). Black points and blue crosses are synthetic and observed asteroids, respectively.
Current usage metrics show cumulative count of Article Views (full-text article views including HTML views, PDF and ePub downloads, according to the available data) and Abstracts Views on Vision4Press platform.
Data correspond to usage on the plateform after 2015. The current usage metrics is available 48-96 hours after online publication and is updated daily on week days.
Initial download of the metrics may take a while.