Fig. 10
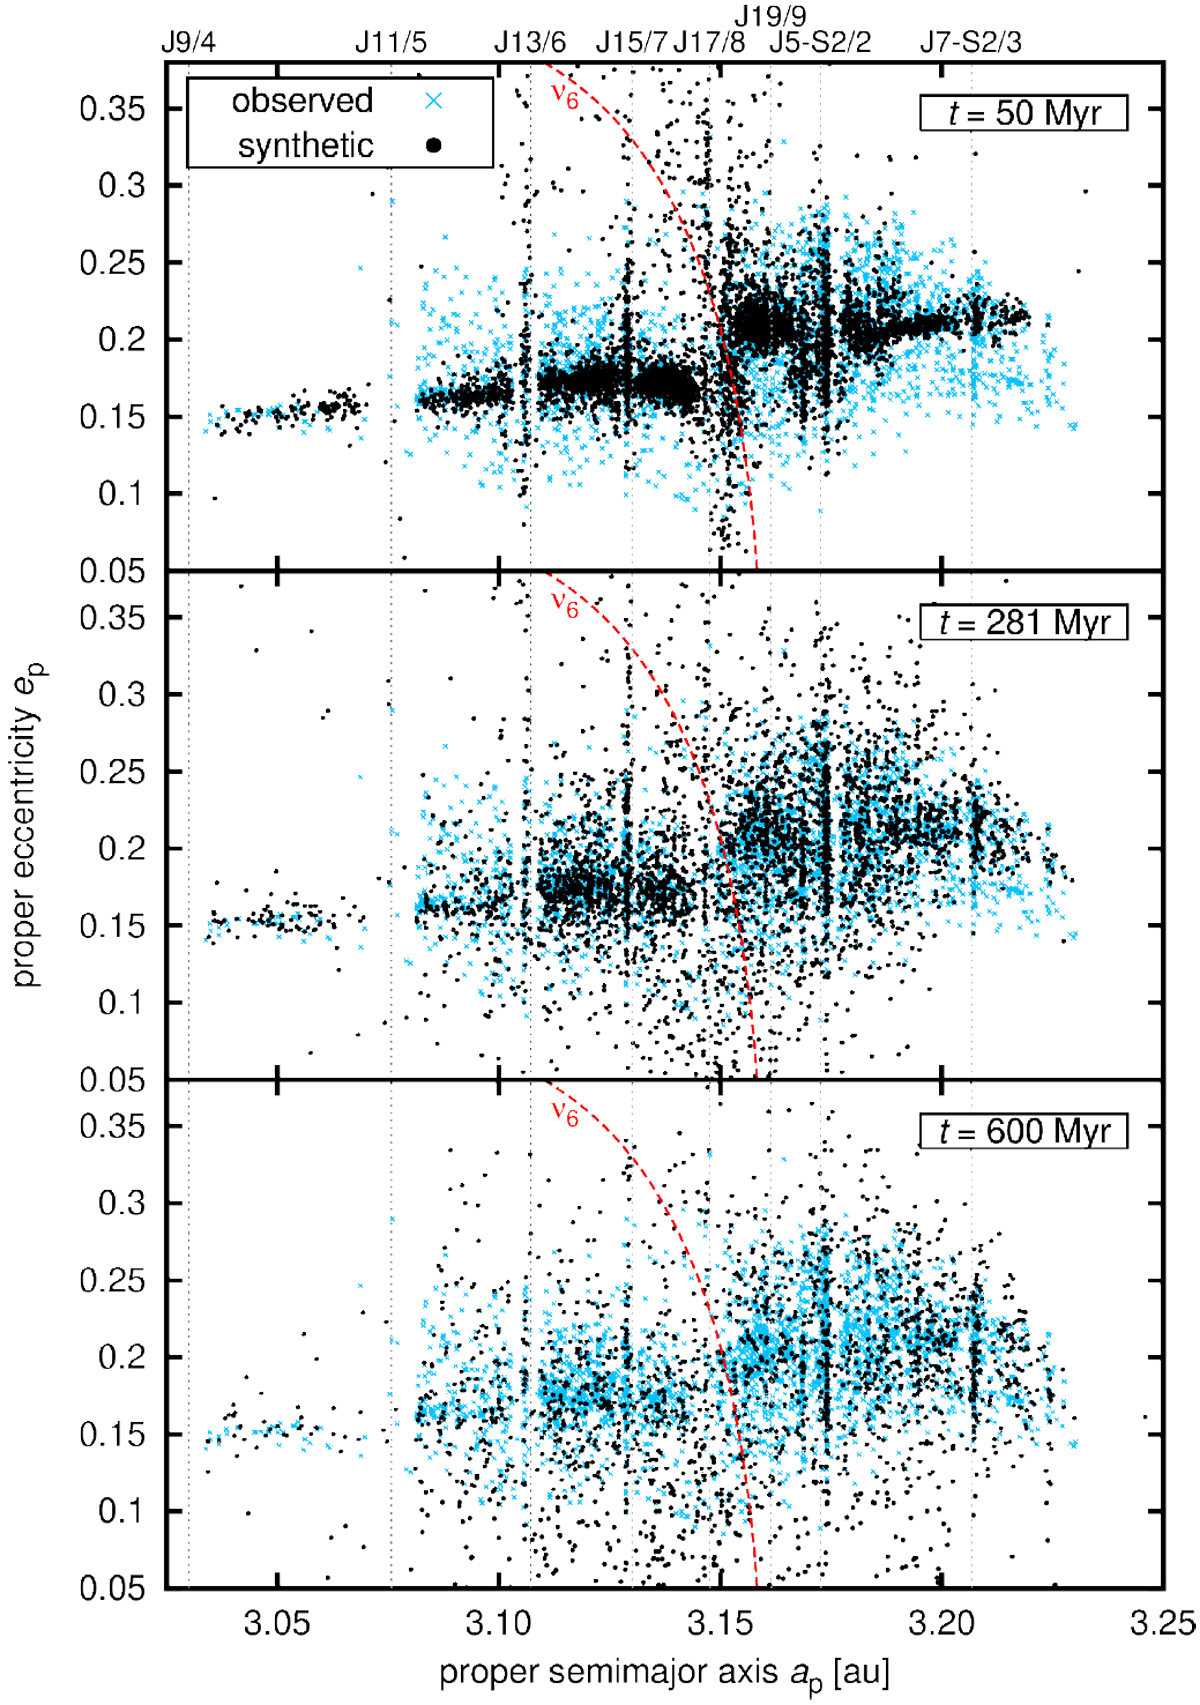
Orbital evolution of the synthetic family (black circles) compared to the orbital distribution of the observed members of the actual Euphrosyne family (blue crosses) in the proper (ap, ep) plane. Dotted vertical lines are centers of several two-body and three-body mean-motion resonances located in the region of interest. The red dashed curve shows the approximate position of the ν6 secular resonance (adapted from Carruba et al. 2014; Milani et al. 2019). Individual snapshots, labeled with a corresponding integration time t, map the progress of our N-body simulation. They depict a compact family, the “best-fit” solution, and a dynamically dispersed family.
Current usage metrics show cumulative count of Article Views (full-text article views including HTML views, PDF and ePub downloads, according to the available data) and Abstracts Views on Vision4Press platform.
Data correspond to usage on the plateform after 2015. The current usage metrics is available 48-96 hours after online publication and is updated daily on week days.
Initial download of the metrics may take a while.