Fig. 9
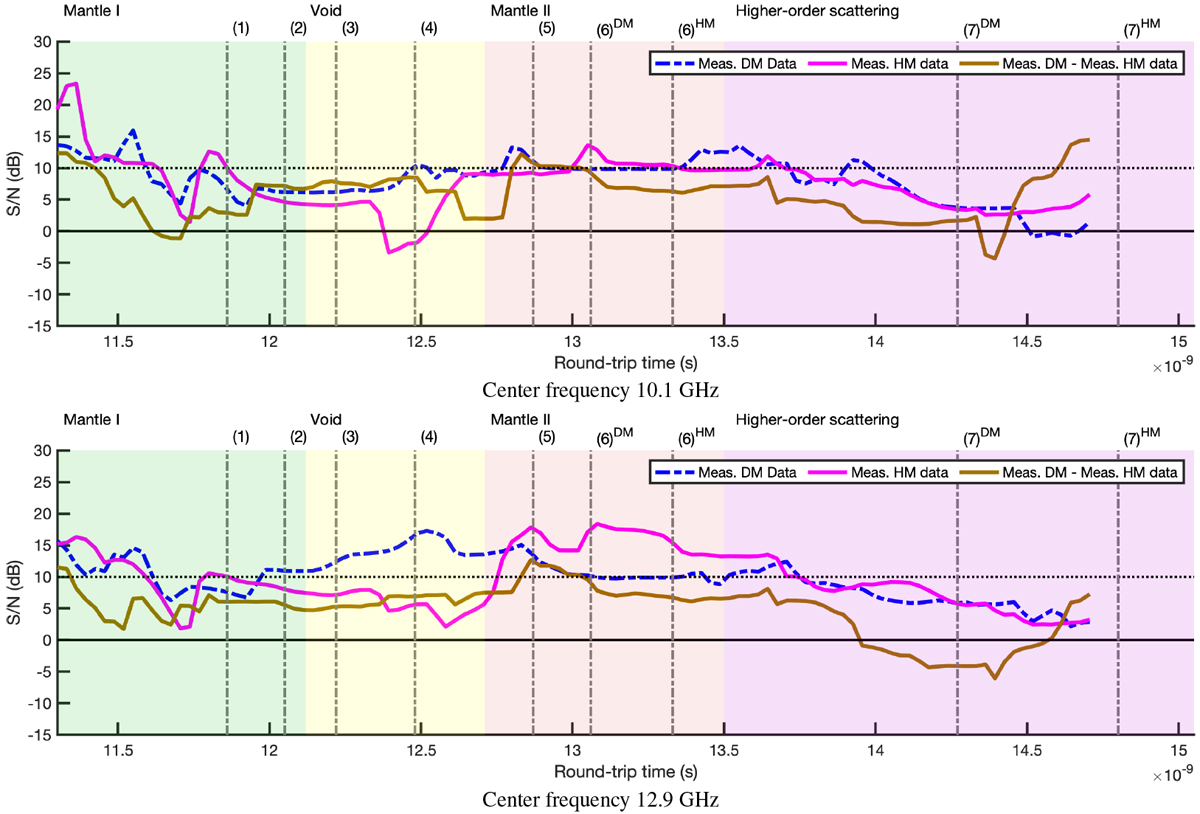
Moving peak S/N between the measurement and FETD simulation for the DM (dashed blue), HM (solid purple), and DM–HM difference (solid brown) signal. Here, the mean power of the simulated signal is normalized to that of the measured one and the length of the moving window is 0.5 ns. Of the center frequencies, 10.1 and 12.9 GHz, the superior overall level is obtained in the latter case, where the peak S/N for DM is maintained over 10 dB (horizontal dashed line) on the interval 11.95–13.4 ns starting in the Mantle I zone, continuing through the void zone almost to the end of the mantle II zone.
Current usage metrics show cumulative count of Article Views (full-text article views including HTML views, PDF and ePub downloads, according to the available data) and Abstracts Views on Vision4Press platform.
Data correspond to usage on the plateform after 2015. The current usage metrics is available 48-96 hours after online publication and is updated daily on week days.
Initial download of the metrics may take a while.