Fig. 8
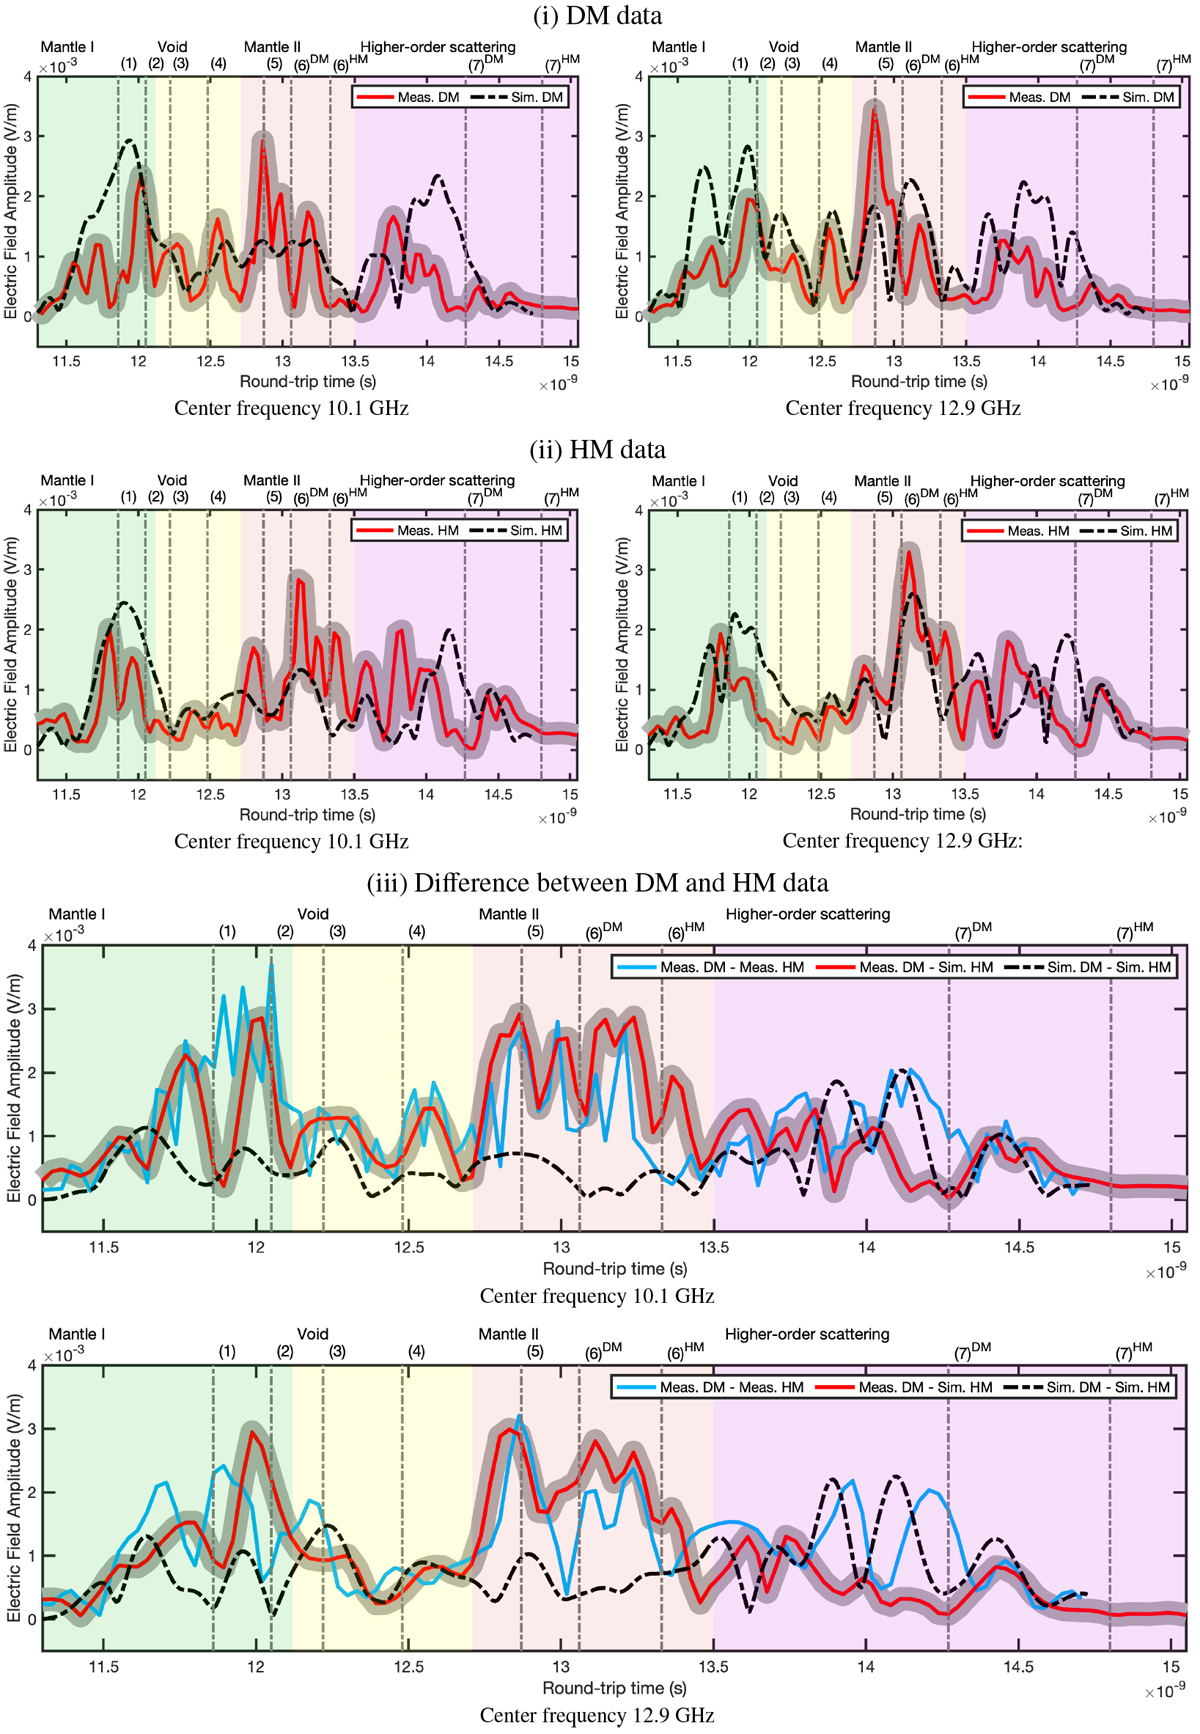
Comparison of the between the measurements and finite element time-domain (FETD) simulation data for the center frequency of 10.1 and 12.9 GHz and ϕϕ polarizationat the central transmitter–receiver position. The solid red and dashed black curve depict the measured and simulated signals, respectively. The shadowed region around the measured signal (red) shows the approximate of the maximum observed error in the reference measurement (Sect. 2.3.2) indicating the credibility of the measurement. The results for the (i) HM and (ii) DM analogs are shown in the top and middle panels, respectively. Bottom panel: (iii) difference between the DM and HM data (Sim. = Simulated, Meas. = Measured). The vertical lines (1)–(7) depict the a priori estimated travel-times (Table 3) of the wavefronts scattering from the surface, mantle, and void matching roughly with the peaks of the measured field and the simulated DM data. These peaks are emphasized in the difference data. Of the center frequencies 10.1 and 12.9 GHz, the latter one yields a superior match between the measured and simulated data.
Current usage metrics show cumulative count of Article Views (full-text article views including HTML views, PDF and ePub downloads, according to the available data) and Abstracts Views on Vision4Press platform.
Data correspond to usage on the plateform after 2015. The current usage metrics is available 48-96 hours after online publication and is updated daily on week days.
Initial download of the metrics may take a while.