Fig. 5.
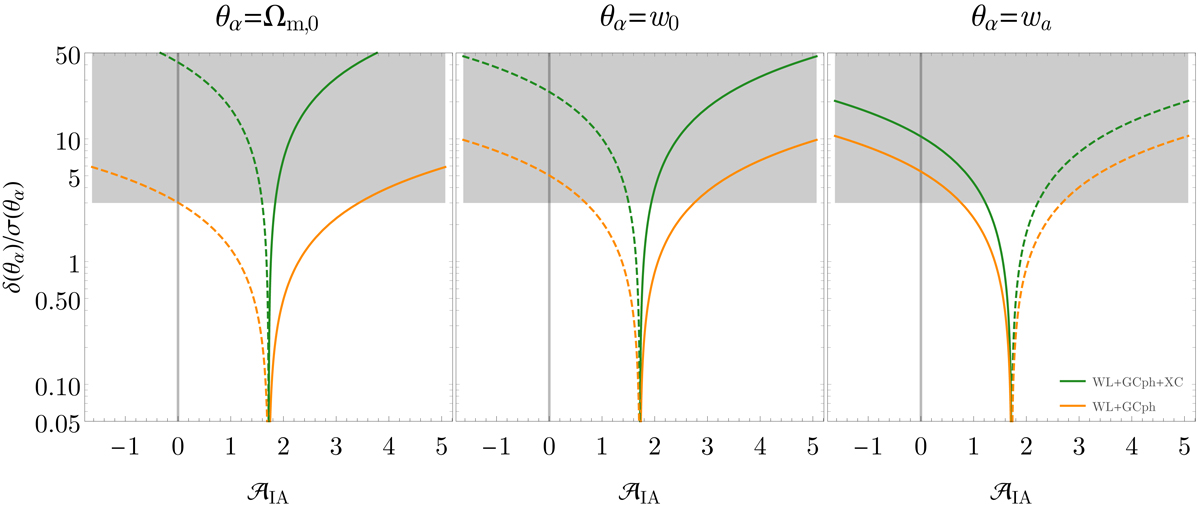
Shifts in units of standard deviations for Ωm, 0 (left panel), w0 (middle panel), and wa (right panel) due to an incorrect assumption on the IA amplitude. Results are shown for the optimistic case with WL+GCph (orange) vs. WL+GCph+XC (green). Solid (dashed) lines represent positive (negative) shifts with respect to the fiducial. The vertical grey line shows the case in which we assume no contribution from IA (𝒜IA = 0). The grey-shaded region denotes the shifts larger than 3σ, for which the Gaussian approximation breaks down and the corresponding shifts should be interpreted with caution (see the text for details).
Current usage metrics show cumulative count of Article Views (full-text article views including HTML views, PDF and ePub downloads, according to the available data) and Abstracts Views on Vision4Press platform.
Data correspond to usage on the plateform after 2015. The current usage metrics is available 48-96 hours after online publication and is updated daily on week days.
Initial download of the metrics may take a while.