Fig. 2.
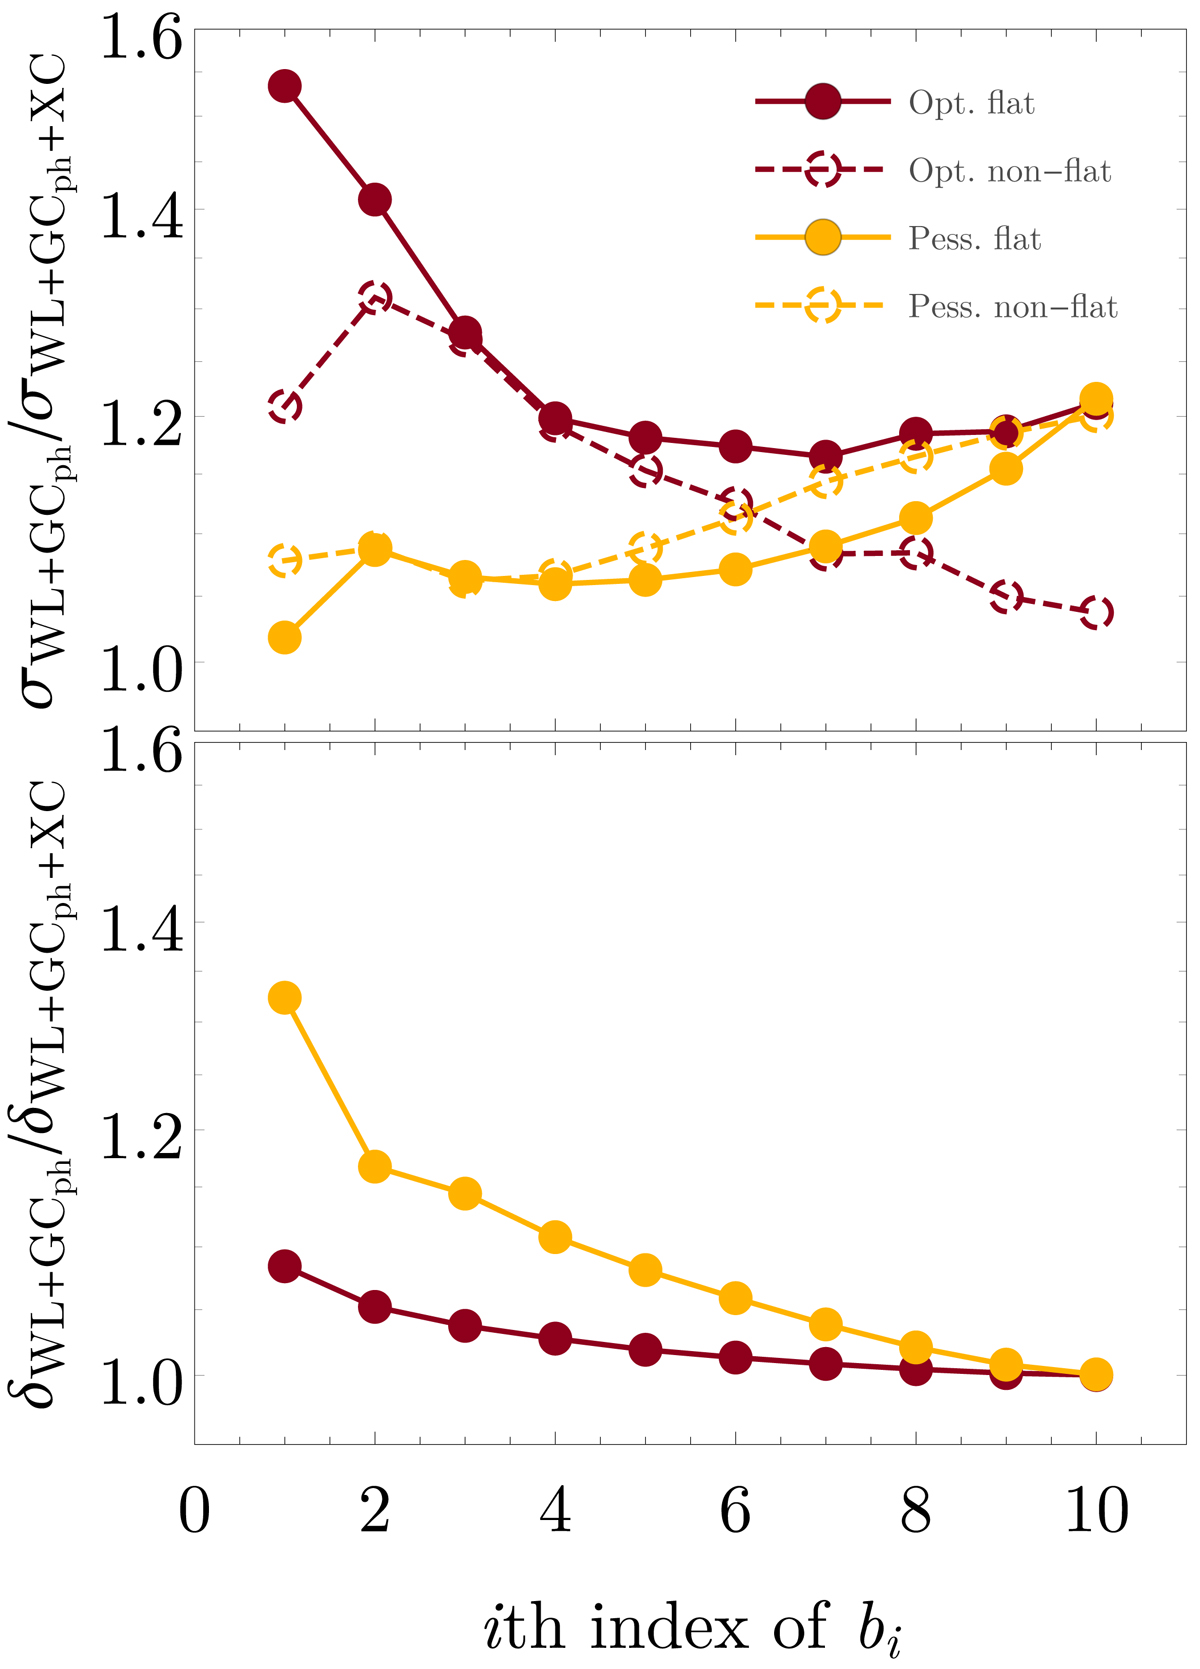
Ratio of the marginalised (top panel) and unmarginalised (bottom panel) forecast uncertainties on the bi bias parameters between WL+GCph and WL+GCph+XC, in the pessimistic (red lines) and optimistic (yellow lines) cases. We show in this plot results for both the flat Universe model (solid lines) and the non-flat case (dashed lines).
Current usage metrics show cumulative count of Article Views (full-text article views including HTML views, PDF and ePub downloads, according to the available data) and Abstracts Views on Vision4Press platform.
Data correspond to usage on the plateform after 2015. The current usage metrics is available 48-96 hours after online publication and is updated daily on week days.
Initial download of the metrics may take a while.