Fig. 4.
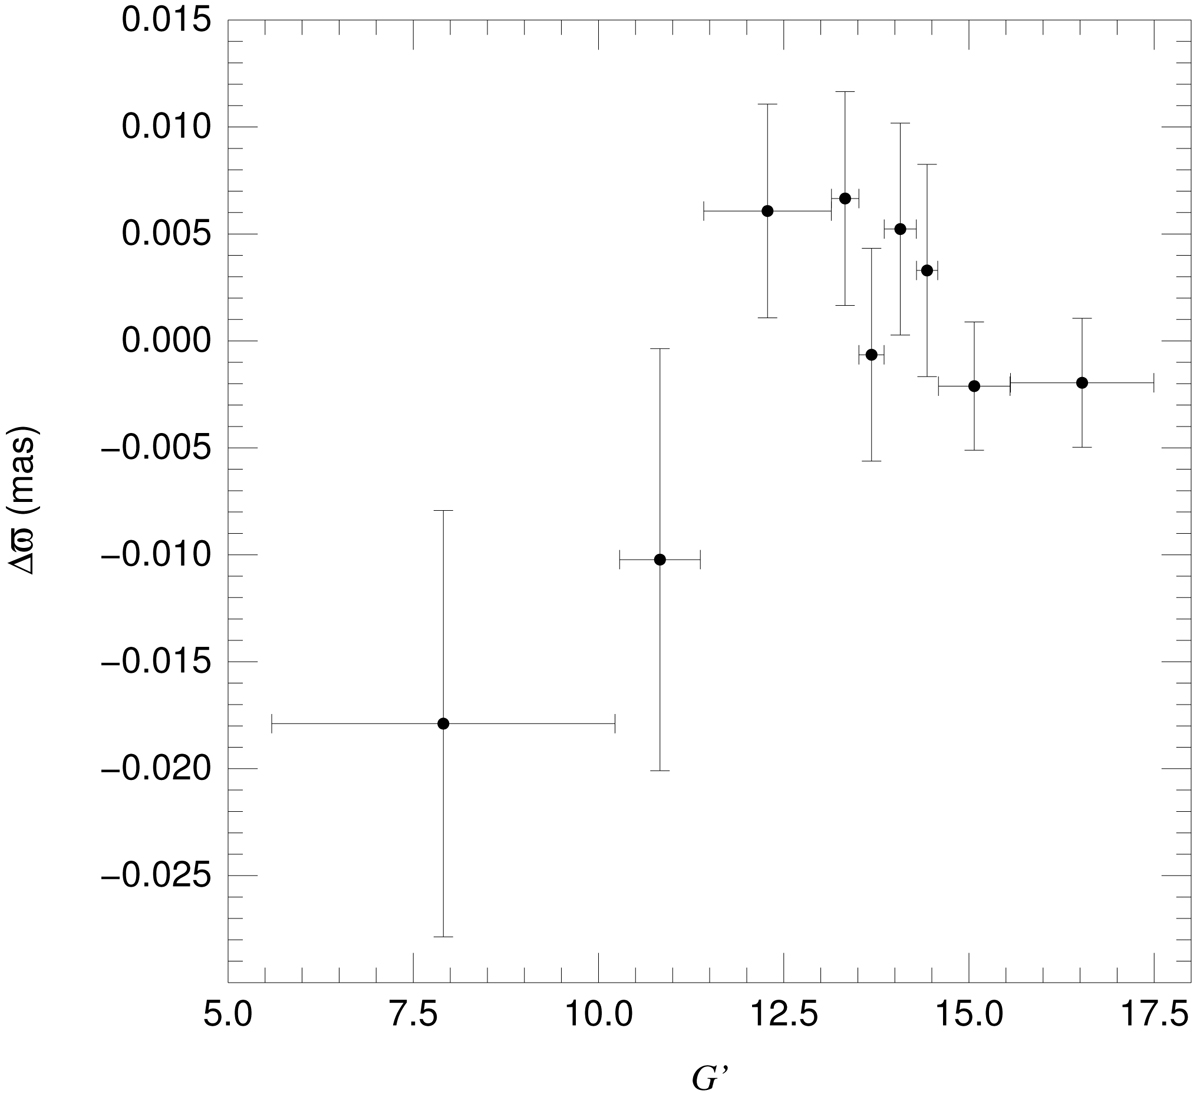
Difference between individual stellar parallaxes and the group parallax as a function of G′ for the stars in Villafranca O-001 to Villafranca O-013 plus Villafranca O-015 and Villafranca O-016. The data have been binned to see the effect as a function of magnitude. The horizontal error bars show the extent of G′ magnitudes binned and the vertical error bars show the weighted standard deviation of the mean using as inputs the values with the external uncertainties.
Current usage metrics show cumulative count of Article Views (full-text article views including HTML views, PDF and ePub downloads, according to the available data) and Abstracts Views on Vision4Press platform.
Data correspond to usage on the plateform after 2015. The current usage metrics is available 48-96 hours after online publication and is updated daily on week days.
Initial download of the metrics may take a while.