Fig. 8.
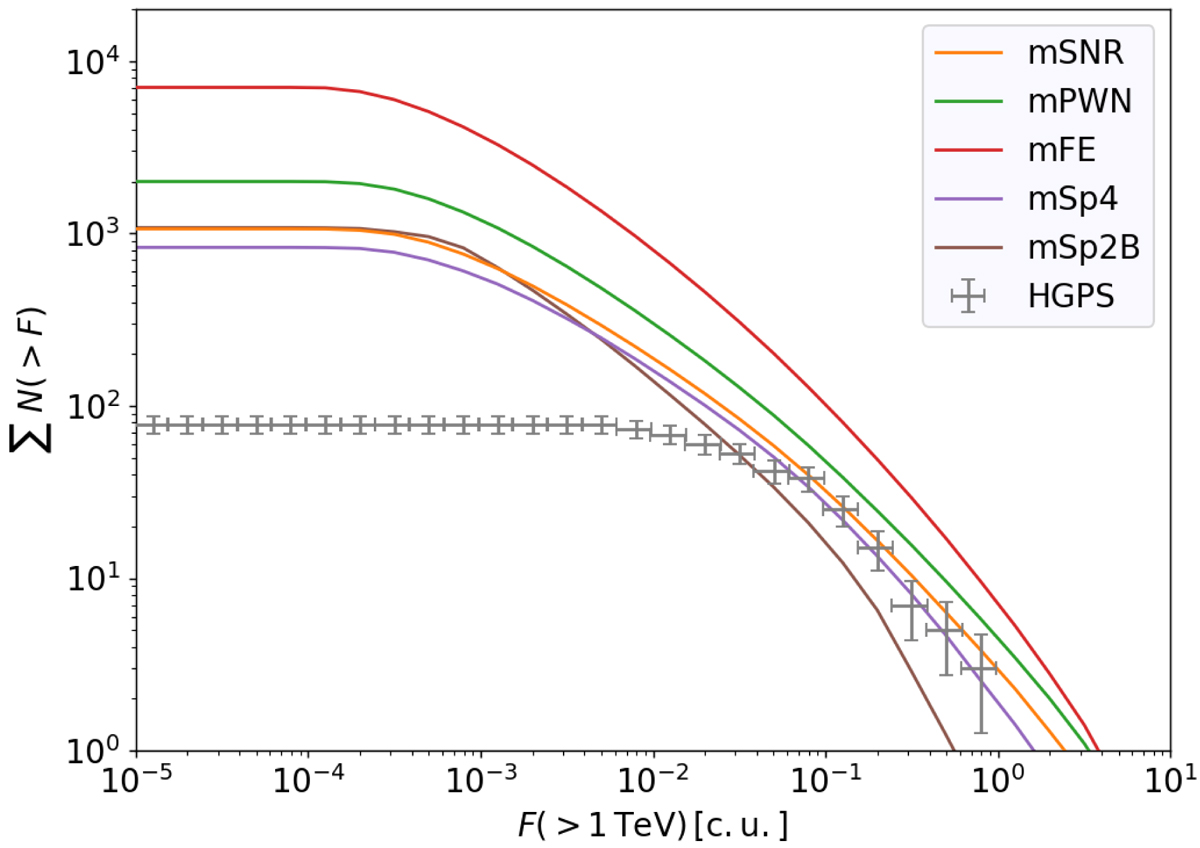
Cumulative source distribution over flux (log(N)−log(F)). The HGPS source distribution is given by grey points with horizontal error bars depicting the bin width and vertical error bars showing the Poissonian error. Coloured lines represent the distribution of the whole Galactic source population averaged over the different realisations of the respective model. As the whole population also includes sources outside the FoV or too extended to be detectable, most models also overshoot the HGPS data in the range of completeness for point-like sources. Only mSp2B is in clear conflict with HGPS data.
Current usage metrics show cumulative count of Article Views (full-text article views including HTML views, PDF and ePub downloads, according to the available data) and Abstracts Views on Vision4Press platform.
Data correspond to usage on the plateform after 2015. The current usage metrics is available 48-96 hours after online publication and is updated daily on week days.
Initial download of the metrics may take a while.