Open Access
Fig. 4.
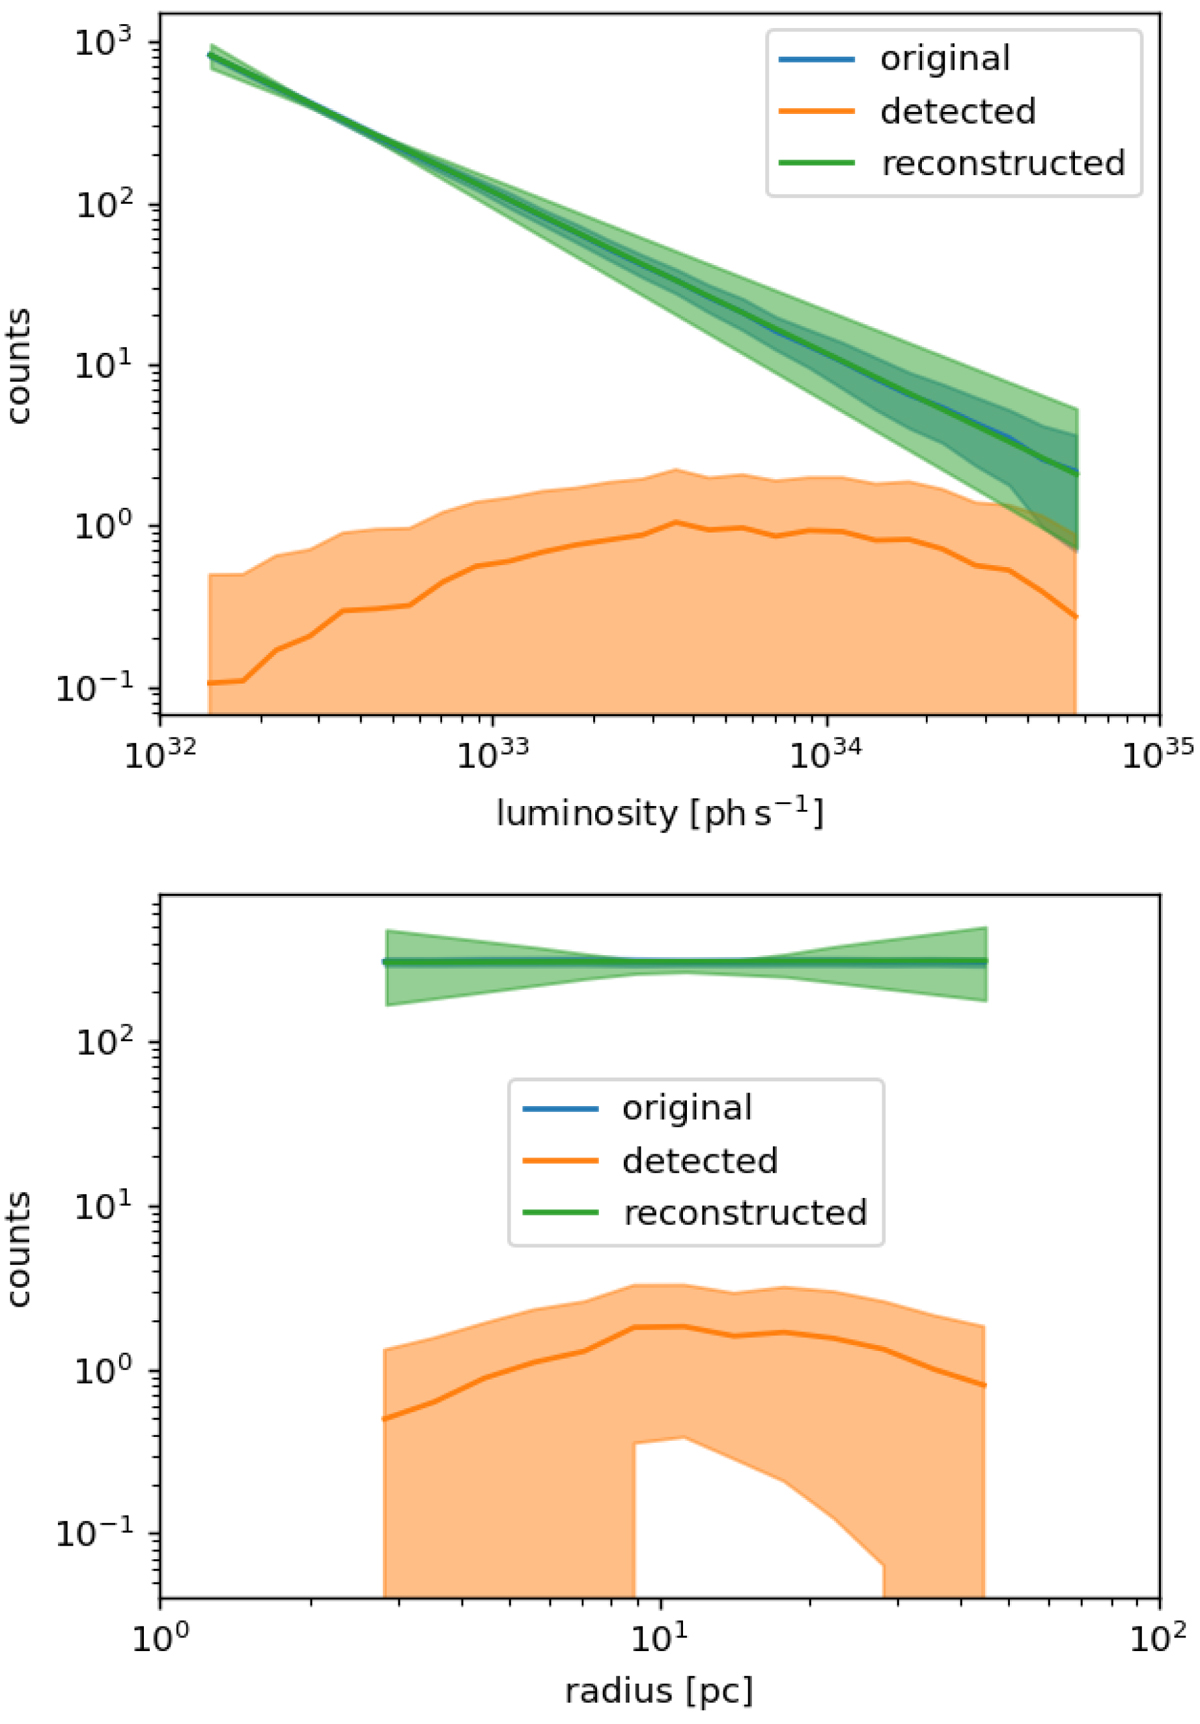
One-dimensional luminosity distribution (top) and radius distribution (bottom) for simulated populations. Original distributions are given in blue; distribution of detected sources in orange and the bias-corrected reconstruction of the original distribution are shown in green. Details are given in the text.
Current usage metrics show cumulative count of Article Views (full-text article views including HTML views, PDF and ePub downloads, according to the available data) and Abstracts Views on Vision4Press platform.
Data correspond to usage on the plateform after 2015. The current usage metrics is available 48-96 hours after online publication and is updated daily on week days.
Initial download of the metrics may take a while.