| Issue |
A&A
Volume 643, November 2020
|
|
|---|---|---|
| Article Number | A62 | |
| Number of page(s) | 9 | |
| Section | Stellar structure and evolution | |
| DOI | https://doi.org/10.1051/0004-6361/202038093 | |
| Published online | 03 November 2020 | |
Observations of GRO J1744–28 in quiescence with XMM-Newton
1
Institut für Astronomie und Astrophysik, Universität Tübingen, Sand 1, 72076 Tübingen, Germany
e-mail: doroshv@astro.uni-tuebingen.de
2
Space Research Institute of the Russian Academy of Sciences, Profsoyuznaya Str. 84/32, Moscow 117997, Russia
3
Kazan Federal University, Kremlevskaya Str. 18, Kazan 42008, Russia
4
Department of Physics and Astronomy, University of Turku, 20014 Turku, Finland
Received:
4
April
2020
Accepted:
31
August
2020
We report on the deep observations of the “bursting pulsar” GRO J1744–28, which were performed with XMM-Newton and aimed to clarify the origin of its X-ray emission in quiescence. We detect the source at a luminosity level of ∼1034 erg s−1 with an X-ray spectrum that is consistent with the power law, blackbody, or accretion-heated neutron star atmosphere models. The improved X-ray localization of the source allowed us to confirm the previously identified candidate optical counterpart as a relatively massive G/K III star at 8 kpc close to the Galactic center, implying an almost face-on view of the binary system. Although we could only find a nonrestricting upper limit on the pulsed fraction of ∼20%, the observed hard X-ray spectrum and strong long-term variability of the X-ray flux suggest that the source is also still accreting when not in outburst. The luminosity corresponding to the onset of centrifugal inhibition of accretion is thus estimated to be at least two orders of magnitude lower than previously reported. We discuss this finding in the context of previous studies and argue that the results indicate a multipole structure in the magnetic field with the first dipole term of ∼1010 G, which is much lower than previously assumed.
Key words: accretion / accretion disks / pulsars: general / scattering / magnetic fields / X-rays: binaries
© ESO 2020
1. Introduction
The bright hard X-ray transient GRO J1744–28 was discovered near the Galactic center with the Burst and Transient Source Experiment on the Compton Gamma-Ray Observatory (CGRO BATSE) during its 1995 outburst. The source is bursting and pulsating with a spin period of 467 ms (Fishman et al. 1995; Finger et al. 1996a; Kouveliotou et al. 1996). The bursting activity makes GRO J1744–28 a very peculiar X-ray pulsar, usually referred to as a “bursting pulsar”. The origin of the bursts is not fully understood. However, as largely discussed in literature, bursts could arise from instabilities in the accretion flow at the inner edge of the accretion disk, which could produce fluctuations in the accretion rate (Hoffman et al. 1978). This hypothesis is strongly supported by the decrease in the accretion rate immediately following the bursts. On the other hand, a thermal component in the burst X-ray spectra has been observed as well (Doroshenko et al. 2015a), which suggests that bursts may be accompanied by thermonuclear burning.
An analysis of the spin modulation of the pulsar allowed us to constrain the orbital parameters of the system and put an upper limit on the companion mass and on the magnetic field of the neutron star (Finger et al. 1996b). In particular, the low observed projected semi-major axis (a sin i ∼ 2.6 light s) implies a low-mass companion with a mass of ≤1 M⊙ unless the system is viewed almost precisely face-on (Finger et al. 1996b), which is unlikely for a randomly oriented binary orbit (probability of less than 0.5% for i ≤ 5.3°), and it also implies a companion mass of ≤1 M⊙ (see, for instance, Finger et al. 1996b). The evolutionary considerations also support a low-mass companion (Rappaport & Joss 1997), although the upper limit on the companion mass of ∼1.3 M⊙ is also mostly imposed by the low probability of observing a binary system face on in this case.
The low mass of the potential counterpart, and likely the location of the binary close to the Galactic center, prevented any robust identification of an optical companion; although, several candidates have been suggested (Augusteijn et al. 1997; Gosling et al. 2007). The most promising candidate was identified by Gosling et al. (2007) as a G/K III star close to the Galactic center based on the X-ray position of the source found using Chandra observations in quiescence (Wijnands & Wang 2002) and VLT spectro-photometry. With an estimated mass of 2 − 3 M⊙, such a star would be close to filling its Roche lobe, which would explain the observed powerful X-ray outbursts. As discussed by Gosling et al. (2007), this candidate appears to still be consistent with the evolutionary considerations discussed by Rappaport & Joss (1997); although, a very low inclination is still required to satisfy the observed mass function in this case. Therefore, another nearby star was suggested as an alternative counterpart (Gosling et al. 2007) at ∼3.75 kpc. Gosling et al. (2007) emphasized, however, that the companion cannot be robustly identified until an improved X-ray localization and deeper optical observations become available.
In the absence of a reliable optical association, most investigations of the source properties have been conducted in the X-ray band, particularly during the two outbursts observed in 1995 and 2014. An analysis of the 1995 outburst data made it possible to determine the orbit of the system and to obtain an upper limit on the magnetic field of ∼6 × 10¹¹ G for the neutron star based on the nondetection of a propeller transition (Finger et al. 1996b). This conclusion appears to be consistent with evolutionary arguments (Rappaport & Joss 1997), and it constitutes another argument for GRO J1744–28 being a rather unusual source with the field being midway between the accreting pulsars and millisecond accreting pulsars. These estimates were later confirmed by the claimed detection of the source transition to the so-called propeller regime in the declining part of the 1995 outburst (Illarionov & Sunyaev 1975; Stella et al. 1986; Cui 1997). The “propeller” effect, or the centrifugal inhibition of the accretion, sets in when the magnetic field lines at the magnetosphere boundary move faster than the Keplerian disk, which allows one to estimate the field from the observed luminosity of the transition, defining the size of the magnetosphere. In particular, Cui (1997) estimated the magnetic field at ∼2.4 × 10¹¹ G. Finally, the magnetic field was also measured directly as B ∼ 5 × 10¹¹ G with the detection of a cyclotron line at ∼4.3 − 4.7 keV during the same outburst with BeppoSAX (Doroshenko et al. 2015a) and in 2014 with XMM-Newton (D’Aì et al. 2015). Besides that, extensive monitoring of the source with the Rossi X-ray Timing explorer (RXTE; Jahoda et al. 1996), the Compton Gamma Ray Observatory (CGRO), and other facilities has revealed a rich phenomenology for burst and persistent emission properties as well as their dependence on luminosity (Fox et al. 1998; Stark et al. 1998; Woods et al. 1999, 2000; Finger 2004; Court et al. 2018a; Ji et al. 2019), which is still largely unexplored.
Another surprise came when Mönkkönen et al. (2019) recently reported a discovery of a radiation-pressure dominated (RPD) accretion disk in this source based on the analysis of high-frequency variability as observed by RXTE. This made it possible to independently estimate the magnetosphere’s size, which turned out to be significantly smaller than expected assuming a magnetic field estimate based on the observed cyclotron line energy. In particular, Mönkkönen et al. (2019) found that the effective magnetosphere size must be an order of magnitude smaller compared to the canonical Alfvén radius. Mönkkönen et al. (2019) pointed to uncertainties in the interaction of the RPD disk with the magnetosphere or the presence of strong multi-pole components of the magnetic field as a reason for this discrepancy.
We note that comparatively small magnetospheric radii were also found by other authors. Based on the analysis of the observed spin-up rate dependence on luminosity during the 2014 outburst, Sanna et al. (2017) came to the same conclusion suggesting that ξ ∼ 0.13 − 0.46, which corresponds to a distance of 5.1−3.4 kpc, respectively, is required to reconcile the observed spin-up rate and cyclotron line energy. We note that the observed spin-up rate would imply even lower values for ξ for the assumed distance of 8 kpc. Under assumptions used by Sanna et al. (2017) to derive an analytic estimate for ξ, this would require, however, an unreasonably low disk viscosity, so the authors opted to put an upper limit on the distance instead. On the other hand, Sanna et al. (2017) ignored any possible braking torques reducing the expected spin-up rate, which could increase the magnetosphere’s size. While accretion torque applied at the inner accretion disk is expected to be dominant at high accretion rates, we note that the deviation of the observed power law dependence of the spin-up rate on the flux from the expected 6/7 index (Bildsten et al. 1997) indicates that a complete account of all the terms that drive the spin evolution of the source is clearly quite complex, and thus biases can be introduced when deriving the radius of the magnetosphere, for example.
Nevertheless, evidence for a compact magnetosphere was also reported by Degenaar et al. (2014) based on the 6.7 keV iron line properties, and by D’Aì et al. (2015) and Younes et al. (2015) based on the properties of the thermal component likely coming from the inner edge of the accretion disk. In all cases, the effective magnetosphere size Rm was found to be only ∼10 − 20% of the Alfvén radius for spherical

defining the radius where the ram pressure of the accretion flow and magnetic pressure are balanced. Here, M and R6 are the mass and radius of the compact object in units of solar mass and 106 cm, μ30 is the magnetic dipole moment in units of 1030 G cm3, and L37 is the accretion luminosity in units of 1037 erg s−1. Generally, larger values are expected and a clear understanding of this discrepancy is, however, still lacking. Independent estimates of the distance to the source and of the magnetic field are, therefore, desirable.
In this paper, we report on the deepest observations to date of the source in quiescence with XMM-Newton (Jansen et al. 2001), which are aimed to provide a better localization of the source and to help us understand whether accretion continues in quiescence. As a result, we were able to confirm one of the previously identified optical counterpart candidates, which strongly suggests that GRO J1744–28 is indeed located close to the Galactic center. We also discuss our results in the context of other investigations and available archival observations in quiescence. In particular, we find that the observed hard spectrum and strong variability strongly suggest that the accretion indeed continues down to luminosities of ∼1034 erg s−1 (assuming distance of 8 kpc), which also implies that the magnetosphere of the pulsar must be small compared to expectations based on the observed cyclotron line energy, and we discuss possible reasons for this.
2. Observations and data analysis
The source has mostly been observed during outbursts, however, some observations in quiescence are also available. Two of those were used to provide the most accurate X-ray localization to date, that is, with XMM-Newton (Jansen et al. 2001; Strüder et al. 2001; Daigne et al. 2002) and Chandra (Weisskopf et al. 2000; Garmire et al. 2003; Wijnands & Wang 2002). Surprisingly, these are not the only detections of the source in quiescence, which was routinely serendipitously observed by XMM-Newton as part of the Galactic center monitoring program. In all but one case, the source was significantly detected; the exception being observation 0112971201 where only PN was operating and the orbital background was quite high.
Here we report on 62 ks observation of the source in quiescence with XMM-Newton (the deepest to date), which was performed on Apr 4, 2019 (obsid. 0821120101). The observation was conducted in full-frame mode for EPIC PN (Strüder et al. 2001) and small-window mode for MOS (Turner et al. 2001) to avoid a possible pileup. The data reduction was done using the XMM SAS version 18.0 and the current set of calibration files as of Feb 2020 following recommended procedures. Besides that, we use the fluxes reported in the 4XMM-DR9 catalog (Watson et al. 2009; Rosen et al. 2016) for other observations.
2.1. Updated X-ray position and the optical counterpart
The location of GRO J1744–28 in the crowded region close to the Galactic center complicates the identification of the optical counterpart. The most accurate X-ray localization of the source so far has been reported by Wijnands & Wang (2002) based on the Chandra observation in quiescence, which was used by Gosling et al. (2007) to identify two potential counterparts within ∼0.8″ X-ray error circle. An improved X-ray localization of the source is, therefore, necessary to discriminate between the two. The Chandra pointing uncertainty dominates the accuracy of the localization and can only be improved through field rectification by matching the position of other detected X-ray sources with those of their optical counterparts. This procedure can actually be easier for XMM-Newton with its larger field of view, and it is routinely used, for instance, in the XMM-Newton serendipitous source catalog (SSC; Watson et al. 2009; Rosen et al. 2016). The latest release of this catalog, 4XMM-DR9, in fact already contains seven measurements of the X-ray position for GRO J1744–28 with an estimated accuracy, including the remaining systematics, that ranges from ∼0.65″ to ∼1.5″, that is to say it is comparable with that of Chandra. The latest and deepest observation analyzed in this work is, however, not included in this catalog. We followed, therefore, a similar pointing rectification procedure as implemented by Watson et al. (2009) to also obtain the position of the source for this observation.
In particular, after running the screening for periods of high in-orbit background with tasks pn-filter/mos-filter, which reduced the effective exposure to ∼28 ks for EPIC PN and to ∼50 ks for MOS, an image of the field was extracted. We then ran the source detection chain edetect_chain in the 1−7.2 keV band (the lower energy band is strongly affected by absorption) for all three cameras, which revealed 59 X-ray sources with potential optical counterparts within 10″ from the X-ray position in the Gaia DR2 catalog (Gaia Collaboration 2018). We then matched the X-ray and optical positions, obtaining the corrected X-ray positions for all sources in the field using the SAS task eposcorr. The residual systematics for matched sources was estimated at 0.35″ (i.e., comparable to that reported for 4XMM-DR9), using the task evalcorr, and added in quadrature to the statistical uncertainty. Thus for GRO J1744–28, we find RA = 17:44:33.08 and Dec = −28:44:26.93 with the uncertainty of 0.38″. We note that our estimate is still dominated by systematics, but it has substantially improved compared to Chandra.
To further improve the accuracy, in addition to our new estimate, we also considered all previously reported XMM-Newton and Chandra positions from catalogs. For each measurement a χ2 statistics was calculated as  , where Δi is the distance between a given point and an individual position estimate, and σi is the reported uncertainty for the corresponding measurement, which includes the estimated systematics. This fit yielded the final position of RA = 17:44:33.08 Dec = −28:44:27.03, corresponding to a χ2 minimum value of 16.7 (for 7 degrees of freedom). The final positional uncertainty can then be estimated by comparing this value with the statistics at an arbitrary distance, that is, projection, by finding distances corresponding to change in the statistic value of Δχ2 = 2.3, 6.18, and 11.83 for 1 − 3σ confidence levels, respectively. The resulting contours are shown in Fig. 1 and can be approximated with circles with radii of ∼0.37″ (1σ confidence) to ∼0.89″ (3σ confidence). We emphasize that this estimate already accounts for systematic uncertainties of individual positional measurements. One might argue that the final fit implies relatively large reduced statistics, which is, however, driven by a single, strongly deviating position reported in the 4XMM-DR9 catalog (for obsid. 0506291201), which is inconsistent with both positions found for Chandra and XMM-Newton in this work. The source is located, however, close to the edge of the field of view in this observation, so the accuracy of the position may be compromised and thus it is likely an outlier. We still include it in the fit for completeness, but emphasize that exclusion of this observation would move the location of the source closer to what was found by us and Chandra; additionally, at the same time, it would slightly reduce the uncertainty. Even if this position is included, however, the alternative optical companion (companion b) suggested by Gosling et al. (2007) is still ruled out at more than 3σ confidence. The comparatively massive G/K III star is thus the preferred counterpart. As discussed by Gosling et al. (2007), this implies that the system must be viewed essentially face on, and the distance to the optical counterpart is consistent with a distance to the Galactic center in this case.
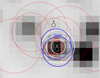 |
Fig. 1. Deep stack Ks band image from the VVV survey (Minniti et al. 2010). Location of the two counterparts (labeled a and b in the picture with respective uncertainties indicated by circle radii) suggested by Gosling et al. (2007) with X-ray positions of GRO J1744–28, reported by Wijnands & Wang (2002), and in the CSC 2.0 catalog (blue), the 4XMM-DR9 catalog (thin red lines), and as obtained in this work (thick red line). The white contours indicate 1 − 3σ confidence levels from the joint fit of all aforementioned X-ray positions obtained as described in the text. |
2.2. Timing analysis
After screening data for periods of high in-orbit background as described above, the scientific data products (i.e., source event lists, light curves, and spectra) for GRO J1744–28 were extracted individually for each of the three cameras from the region centered on the source. The extraction region size was optimized using the eregionanalyse task and was found to be 26″ and 28″ for PN and MOS, respectively. The background spectrum was extracted from nearby regions on the same chip. For MOS, we used an annulus with an inner radius of 45″ and an outer radius that was large enough to include all counts detected in the readout window. For PN, we used a circle with a radius of 45″ located on the same chip as the source and at the same distance along the Y instrumental coordinate as recommended in the documentation of the instruments. The background-subtracted source light curves with a time resolution of 1 ks in the 0.5−10 keV band were then obtained for all three cameras using the task epiclccorr, which performs background subtraction and corrects for difference in effective areas of the source and background and other instrumental effects. Finally, to improve the counting statistics, we co-added the resulting light curves using the lcmath task.
As is evident from Fig. 2, the resulting light curve exhibits significant variability with the flux changing by almost an order of magnitude during the observation. Such variability can only be expected from an accreting neutron star and thus strongly suggests that GRO J1744–28 indeed continues to accrete during the XMM-Newton observation.
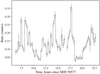 |
Fig. 2. Light curve of GRO J1744–28 with time resolution of 1 ks as observed by XMM-Newton in the 0.5−10 keV energy band (all detectors combined) reveals strong flux variability. |
It is also interesting to re-visit other observations of the source in quiescence to investigate variability on longer timescales. Being close to the Galactic center, GRO J1744–28 has been observed several times with XMM-Newton and Chandra and detected in the majority of observations. To investigate the source variability, we used, therefore, broadband fluxes reported in XMM SSC (Watson et al. 2009; Rosen et al. 2016) and in the Chandra source catalog (Evans et al. 2010). Considering that Chandra fluxes are reported in the 0.5−7 keV band and XMM-Newton fluxes are in 0.2−12 keV, for comparison purposes we applied a correction factor of 1.53 in the former case as estimated from the best-fit spectrum for the accretion-heated model. The results are presented in Fig. 3. It is interesting to note that the distribution of observed fluxes appears to be bimodal, clustering around ∼10−12 erg cm−2 s−1 and ∼10−14 erg cm−2 s−1, respectively, that is, the distribution varies by more than an order of magnitude on a timescale of several hundred days. Again, such variability can only be explained by accretion, so we conclude that also historical observations of the source in quiescence strongly imply that GRO J1744–28 continues to accrete during the observations belonging to the group with a higher flux, which includes the observation reported in this work. It is also interesting to note that during the outbursts, persistent emission of GRO J1744–28 appears to be much less variable than we observe in quiescence, which could point to unstable accretion, as is expected around the transition to the propeller regime.
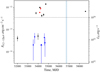 |
Fig. 3. Historical light curve of GRO J1744–28 as observed by XMM-Newton (black points) and Chandra (blue points for HRC and red for ACIS-S cameras). Here, the bolometric luminosity estimated, assuming a distance to the source of 8 kpc and a bolometric correction factor of 3.7, is also indicated. The shaded area indicates the 2014 outburst of the source. The dotted line indicates the propeller luminosity estimated in this work. |
In this context, it is interesting to note that the observed historic flux distribution of GRO J1744–28 resembles the one reported by Tsygankov et al. (2016) for the pulsating ultra-luminous X-ray source M82 X−2, where it was used to argue for the onset of the centrifugal inhibition of the accretion, that is, the transition to a propeller regime (Illarionov & Sunyaev 1975). Furthermore, the observed luminosity gap of ∼100 matches the expected change in luminosity upon the transition to the propeller for the observed period of the source (Corbet 1996). We suggest, therefore, that the two peaks in the observed flux distribution correspond to the accretion and propeller states, respectively.
The detection of the pulsations with an amplitude and pulse profile shape that are similar to what was observed in the outburst would also support an accretion-powered origin of the observed emission. We conducted, therefore, a periodicity search to detect this type of signal. The analysis was conducted using EPIC PN data only because the time resolution of the MOS cameras (0.3 s in small window mode) is insufficient to detect pulsations with an ∼0.467 s period expected from the source. To search for pulsations, we used source photons extracted from the same region, rather than light curves, to prevent sensitivity loss due to the time binning. The energy range for the pulsations search was limited to 2 keV to 7 keV, where most source photons are detected. To increase the number of photons and avoid gaps in the light curve, we also ignored the high in-orbit background periods mentioned above for this analysis. We verified, however, that this does not affect the results by repeating the analysis for screened data. As a result, 3324 photons were selected. Based on the spectral analysis of the results described below, ∼500 of these must be background photons. The photon arrival times were then corrected to the solar barycenter, using the barycent task, and for binary motion, using the ephemerides reported by Sanna et al. (2017). The pulsation search was conducted using the Z2 statistics (de Jager et al. 1989) for periods in the range between 0.466 s and 0.468 s, which is significantly wider than periods historically reported from the source. No significant peaks were found, as is illustrated in Fig. 4.
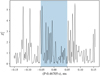 |
Fig. 4. Periodogram for EPIC PN data in 2−7 keV energy range. The shaded area represents the historically reported period range. |
To estimate the sensitivity of our observation to pulsations, we used the method proposed by Brazier (1994) as described in Doroshenko et al. (2015b), which permitted us to put an upper limit on the detectable pulsation amplitude (defined as (max − min)/(max + min) of the count rate over the folded light curve) of ∼20%. We note that the pulsation amplitudes reported for the outburst range between 5 and 20% in the 2−10 keV energy range, and they increase with energy (Doroshenko et al. 2015a), that is, they are consistent with a deduced upper limit. Furthermore, the maximal pulsed fraction expected from a rotating neutron star with two thermally-emitting hotspots (Beloborodov 2002) is comparable to the limit obtained above. We conclude, therefore, that the lack of a clearly detected pulse signal is unsurprising, given the available statistics for this observation.
2.3. Spectral analysis
Our conclusion that the source continues to accrete is also supported by the spectral analysis. As described above, the spectra of the source were extracted individually for each of the three cameras. The source count rate was found to be 0.02 and 0.06 for MOS and PN, respectively, which constitutes ∼80% of the total count rate. This implies that the observation is likely not affected by pile-up. Nevertheless, we confirmed this using the task epatplot. The background, however, dominates the source count rate below ∼1 keV, especially for PN, which is due to the strong absorption in the direction of the source and the residual contribution of the soft proton-induced background. We restricted, therefore, the analysis of the energy band to above 0.5 keV for MOS and above 0.9 keV for PN. The unfolded spectrum of the source and best-fit residuals for several models is presented in Fig. 5.
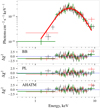 |
Fig. 5. Best-fit unfolded spectrum (with absorbed blackbody model, top), and corresponding residuals for fits with absorbed blackbody (BB), power law (PL), and accretion heated atmosphere (AHATM) models. |
Considering the available counting statistics and the limited energy band covered by XMM-Newton, several models can be used to describe the observed spectrum. In principle, both the absorbed blackbody (tbabs × bbodyrad in XSPEC) and an absorbed power law (tbabs × powerlaw in XSPEC) provide a reasonable description of the spectrum. From a purely statistical point of view the power law fit provides the best fit as summarized in Table 1 and Fig. 5 (all uncertainties are quoted at 1σ confidence unless stated otherwise).
Best-fit parameters for GRO J1744–28 spectrum as observed with XMM-Newton (obsid. 0821120101) and described with an absorbed blackbody (BB), power law (PL), and accretion-heated atmosphere (ATM) models.
No evidence for the presence of an absorption feature is evident from the residuals. That is actually not surprising since the feature was also not detected in the fainter of the three BeppoSAX observations (Doroshenko et al. 2015a) due to the low counting statistics. When a feature is formally included in the fit as a multiplicative Gaussian in absorption (GABS in XSPEC) with the energy and width fixed to that reported by Doroshenko et al. (2015a), the resulting line depth is consistent with zero. On the other hand, the 3σ upper limit on depth of 0.28 is above the value reported in the same paper (0.12), so we conclude that our XMM-Newton observation is not sensitive to the potential presence of a line with reported parameters and thus the presence of the feature cannot be ruled out.
We note that the black-body fit exhibits a systematic structure in residuals, and, what is more important, it yields a rather high temperature of ∼1.2 − 1.3 keV compared to ∼0.5 keV, which is typically reported for cooling neutron stars. That is actually not surprising considering the observed variability of the source, which strongly suggests that GRO J1744–28 is in fact accreting and is in line with the fact that the power law fit is clearly superior from a statistical point of view.
On the other hand, the resulting value of the absorption column (∼14 × 1022 cm−2) is substantially higher compared to values reported by Younes et al. (2015) and D’Aì et al. (2015) for the 2014 outburst based on the broadband spectral analysis (8.8(3) × 1022 cm−2 and 6.1(3) × 1022 cm−2 respectively, the same absorption model was used). This might indicate that there are either changes in intrinsic absorption within the system or problems with the simple power law model. Along with a rather steep resulting power law index, the later option seems to be more realistic and points to a more complex spectral shape.
We attempted, therefore, to fit the spectrum of the source with a physical model aimed to describe the X-ray spectrum of a neutron star atmosphere heated by an accretion flow. The detailed description of the model can be found in the paper by Suleimanov et al. (2018). The code described in the paper allowed us to compute the NS model atmosphere that is heated by the accretion flow by considering the accreting ions as independent fast-moving particles penetrating the atmosphere. The input parameters of the model are the NS mass M and radius R, the relative intrinsic luminosity ℓ = L/LEdd, the relative luminosity due to accretion heating ℓa = La/LEdd, and the chemical composition of the atmosphere. The input parameters of the accretion flow are the relative velocity of the ions η = v/vff, where vff is the free-fall velocity at the NS surface, the relative temperature of the ions χ = T/Tvir, where Tvir is the virial temperature of the ions at the NS surface, and Ψ is the penetration angle of the ions into the atmosphere.
It is important to note that the model does not take the magnetic field into account. We emphasize that this approach leads to potentially significant uncertainties because the cyclotron energy in the spectrum at the high luminosity state at ∼4 − 5 keV is in the range where most of the flux emerges, so our results should only be considered as a first approximation. If the magnetic field is important, GRO J1744–28 could be similar to other X-ray pulsars in low states, such as X Per (Doroshenko et al. 2012), A 0535+262 (Tsygankov et al. 2019a), and GX 304−1 (Tsygankov et al. 2019b). These X-ray pulsars exhibit a two component spectra, where the high energy component is likely associated with cyclotron emission that is broadened with thermal Compton scattering in an overheated atmosphere as it also happens in our nonmagnetic models (see Fig. 6). For GRO J1744–28, the cyclotron emission is expected to fall into the soft X-ray band and may actually represent the main source of seed photons, which would significantly modify the emerging spectrum in analogy to the high energy component in the aforementioned highly magnetized pulsars. Unfortunately, our model is unable to account for this effect as of yet, so we have to resort to a low magnetic-field approximation. On the other hand, as discussed below, the magnetic field of the neutron star could be substantially lower, about ∼1010 G, and in which case our results should be reasonably accurate.
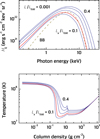 |
Fig. 6. Spectra of the computed accretion heated atmospheres (top panel) and the corresponding temperature structures. The grid models with the relative accretion luminosities La/LEdd = 0.1,0.2,0.3, and 0.4 are shown with blue curves. The best fit model spectra and temperature structure are shown with red curves. The best fit diluted blackbody spectrum in the NS surface frame ( |

We chose the following values of the parameters: M = 1.4 M⊙, R = 12 km, and the normal in-falling of the cold free-falling accreting ions, Ψ = 0°, η = 1, and χ = 0.001. The chemical composition of the atmosphere as well as the accreting plasma were taken to be solar. We then computed a grid of the models with the accreting heating luminosities ℓa = 0.1, 0.2, 0.3, and 0.4, which, along with normalization, are thus the only free parameters that varied during the fit procedure. The intrinsic luminosity of the model atmosphere was taken to be ℓ = 0.001. The emergent spectra and the temperature structures of the models are shown in Fig. 6. The computed spectra were transferred to the distant observer frame, E′=E(1 + z) and FE′ = 4πHE/(1 + z)3, where 1 + z = (1 − 2GM/Rc2)−1/2 = 1.236 for the chosen NS model. The model grid was implemented as an XSPEC table model and used to fit the spectrum. The accretion heated atmosphere model provides a better description of the XMM-Newton spectrum compared to a pure blackbody as well as a lower absorption compared to an absorbed power-law model, which still provides, however, a statistically superior fit. We emphasize that regardless of the model used, the observed spectrum is more compatible with what is expected from an accreting rather than thermally emitting neutron star.
However, using a physical model allows one to make some useful estimates and check for the self-consistency of the model. The best-fit local accretion rate ℓa = 0.134 and this computed model are also shown in Fig. 6. This relative accretion rate corresponds to the effective temperature kTeff = 1.164 keV or the observed one of 0.942 keV. The diluted blackbody spectrum with the back redshifted observed temperature  keV (1 + z) = 1.545 keV is shown as well. The dilution factor, 0.32, is close to the expected value from estimated color correction fc = 1.25/0.942 = 1.33,
  . The derived normalization, 1.38 × 10−36, makes it possible to find the radius of the radiating spot, Rsp ≈ 4.1 × 104 cm, assuming the distance to the source equals 8 kpc and that the emission region is the flat disk inclined with the angle 60° to the line of sight. It is quite likely that the magnetospheric radius is close to the corotation one at this low luminosity, Rm ≈ Rc ≈ 108 cm. In accordance with Mushtukov et al. (2015), the single hot spot area is A = 2πR3/Rm × (H/Rm). Comparing it with the observed hot spot area
  cm2, we can estimate the relative disk half-thickness at the magnetospheric radius H/Rm ≈ 0.05. The expected value at the corotation radius is about 0.03 (see, e.g., Suleimanov et al. 2007), assuming the standard accretion α-disk model (Shakura & Sunyaev 1973), so the hotspot size estimated above is in line with expectations. We also note that the effective temperature at the corotation radius is about 60 kK for a given Ṁ. Therefore, the disk is not in a cold state here, so a transition to the propeller regime is indeed expected as the accretion rate further decreases (Tsygankov et al. 2017a). Thus, we conclude that the heated atmosphere model provides a physically sound description of the observations and supports accretion scenario. We note, however, that broadband observations of the source in quiescence would be more constraining and are important to verify this conclusion and the model itself.
Finally, it is also interesting to note that the source appears to soften at the lowest fluxes, as can be illustrated in Fig. 7. The spectra extracted from the source position for the two observations with the lowest flux (obsid. 0112971901 and 0302884201) contain just over ∼50 source counts in total and thus they are hardly usable for a meaningful spectral analysis. Nevertheless, when described with an absorbed blackbody model (with a fixed absorption column), the best-fit temperature decreases to ∼0.8(1), which is close to values reported by Tsygankov et al. (2017b) for propelling sources. We emphasize, however, that in this case much deeper observations would also be required for a detailed analysis and we prefer to regard hardness as the main indicator of spectral softening.
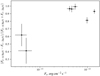 |
Fig. 7. Evolution of spectral hardness reported in the XMM SSC catalog for GRO J1744–28 (HR3 field) as a function of flux. |
3. Discussion
The transition of GRO J1744–28 to the propeller regime has, in fact, been already claimed by several authors (Cui 1997; Court et al. 2018b), albeit for significantly higher luminosities of ∼0.8 − 2.5 × 1037 erg s−1 (Cui 1997; Campana et al. 2018). On the other hand, the lowest flux for the higher flux group of quiescent detections of GRO J1744–28 with Chandra and XMM-Newton correspond to a luminosity of ∼1034 erg s−1. Here, we applied a bolometric correction factor of 3.7 to the observed flux in the 0.2−12 keV band as estimated based on the spectral parameters reported by Doroshenko et al. (2015a) during the outburst. We emphasize again that the source is still detected even significantly below this level, and such variability is inconceivable for the thermal emission from a thermally-emitting neutron star expected if the propeller transition would already take place at 1037 erg s−1. We conclude, therefore, that the true propeller luminosity, that is, the accretion luminosity corresponding to the onset of the propeller effect for GRO J1744–28 is ∼1034 erg s−1, which is three orders of magnitude lower than previously suggested.
The new estimate is, however, significantly lower than theoretical expectations assuming the field derived from cyclotron line energy. Indeed, the propeller luminosity can be estimated by equating the magnetospheric and corotation radii (Campana et al. 2018):

where ξ is the ratio of the magnetospheric radius to the Alfen radius and P is the spin period of a neutron star in seconds. This relation was observationally calibrated by Campana et al. (2018), using multiple types of magnetized accretors, and they found that ξ ≈ 0.49 ± 0.07 and Lprop ∼ 1037 erg s−1 for GRO J1744–28. Here, ξ = 0.5, P ≃ 0.467 s, B = 5 × 10¹¹ G, and μ30 = BR3/2 ≃ 0.32 was assumed. To match the new observed propeller luminosity, one needs to significantly reduce the effective magnetosphere size, that is, the assumed magnetic field or value of ξ. In particular for R6 = 1.2 (Suleimanov et al. 2017), a field of ∼1010 G or ξ ∼ 0.06 would need to be assumed. Of course, the two parameters are correlated, so any combination is possible and quoted values only illustrate extreme values.
Interestingly, the same issue has already been identified and discussed in the context of source properties during an outburst. In particular, Mönkkönen et al. (2019) conclude that the magnetosphere must be small and estimated ξ ∼ 0.09 based on the observed break frequency in the power density spectrum of the source close to the peak of the outburst. As discussed by Mönkkönen et al. (2019), modeling of the broad iron line properties (Nishiuchi et al. 1999; Degenaar et al. 2014) and of the soft blackbody component observed in the X-ray spectrum of the source (D’Aì et al. 2015; Younes et al. 2015) and spin evolution of the source (Sanna et al. 2017) also yield comparable estimates for the inner accretion disk’s radius (assuming a distance of 8 kpc). To resolve this issue, Mönkkönen et al. (2019) suggest that the quadrupole field may dominate the interaction of the accretion disk. The magnetospheric radius

in this case, appears to be consistent with the estimates reported in the literature (Nishiuchi et al. 1999; Degenaar et al. 2014; D’Aì et al. 2015; Younes et al. 2015) and the observed cyclotron line energy for ξ ≃ 1 (Mönkkönen et al. 2019). As illustrated in Fig. 8, it also turns out to be consistent with the propeller transitional luminosity derived in this paper if R6 = 1.2, μ30 = 0.43, and ξ = 0.8 are assumed, that is, a small estimated magnetosphere size could be explained if the magnetic field is dominated by a quadruple component.
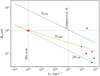 |
Fig. 8. Estimates of the magnetospheric radius published in the literature (black points, see text for references) and obtained in this work (red circle) as a function of luminosity. Theoretical estimates of the magnetospheric radii for dipole Rm, dip, assuming ξ = 0.49 and μ30 = 0.43 (Campana et al. 2018), and quadrupole Rm, quad with ξ = 0.8 and μ30 = 0.43 (Mönkkönen et al. 2019), corotation radius Rc and estimated luminosities for the propeller transition obtained in this work and by Campana et al. (2018; black dotted lines) are also shown. |
On the other hand, simply scaling the estimate for the dipole field by factor ∼8, that is, reducing the assumed field to ∼1010 G or the effective magnetosphere size to ξ ∼ 0.06, gives an equally good (or bad) agreement. We note, however, that assuming a lower field is not only at odds with the observed cyclotron line energy, but it also makes it hard to explain why type I bursts are not observed (Bildsten & Brown 1997). On the other hand, Campana et al. (2018) discuss that ξ ∼ 0.5 appears to be common for most magnetic accretors, so it is hard to explain why it must be so peculiarly low for GRO J1744–28, which makes a quadrupolar field hypothesis more appealing.
Last but not least, it is important to emphasize that assuming a different distance to the source does not resolve the problem. Indeed, for a smaller distance, the propeller luminosity becomes even lower thereby increasing the discrepancy with the expectation given by Eq. (2). A lower assumed distance also implies a lower accretion rate and thus larger expected magnetosphere size in outburst, thereby increasing the discrepancy with the small observed value. On the other hand, increasing the assumed distance hardly helps to account for a difference of three orders of magnitude between the expected and observed propeller luminosities. A similar argument could be made for possible geometric beaming increasing the apparent luminosity of the source and this is thus equivalent to the situation when the distance to the source is over-estimated, as outlined above.
4. Summary and conclusions
Based on the deep XMM-Newton observation of GRO J1744–28 in quiescence and by revisiting the available archival observations, several results discussed above have been obtained:
-
The improved X-ray localization of the source allowed us to confirm the previously suggested optical counterpart as a G/K III star at a distance consistent with the location of GRO J1744–28 in the Galactic center. This identification also implies that the binary system is viewed nearly face on.
-
A strong variability around ∼1034 erg s−1, which was revealed by XMM (for the assumed distance of 8 kpc), implies that the source definitively continues to accrete.
-
Archival data suggest that the object is detected also at much lower (by one to two orders of magnitude) fluxes, but not intermediate flux levels. The observed bimodal flux distribution in the historical light curve and softening at the lowest flux levels thus strongly suggest that GRO J1744–28 transitions to the propeller regime at around ∼1034 erg s−1.
-
The propeller transition takes place, therefore, at a much lower luminosity than previously assumed, which implies that the magnetosphere in GRO J1744–28 is much more compact than can be expected for the field strength implied by the observed cyclotron line energy.
We emphasize that accretion seems to be the only plausible explanation for the observed variability of the source in quiescence, and thus our final conclusion regarding the absolute magnetosphere size is robust. It is also in line with several independent estimates of the magnetosphere size during the outburst, which led to the same conclusion, that is, that the magnetosphere is an order of magnitude smaller than could be expected for the field strength deduced based on the observed cyclotron line energy.
The options to explain this finding have already been discussed in the literature and are fairly limited: Besides potential possible peculiarities in the interaction of the radiatively-dominated accretion disk with the magnetosphere, a grossly overestimated magnetic field, and the presence of a strong multipole field component were suggested. Based on the fact that the magnetosphere also remains compact in quiescence, we conclude that the first option can be ruled out since the accretion disk is definitively not in a radiative-pressure dominated state in quiescence. Considering that the cyclotron line was independently discovered by several authors using the data from several instruments obtained in two independent outbursts, and the absence of Type I bursts expected for such a low field, the second option also appears unlikely. We conclude, therefore, that GRO J1744–28 is a prime candidate neutron star with a complex field morphology. This hypothesis can be tested, for instance, through polarimetric observations with the upcoming IXPE (Weisskopf et al. 2016) and eXTP (Zhang et al. 2016).
Acknowledgments
We thank the anonymous referee for very useful comments which helped to substantially improve the manuscript. This research has made use of data obtained from the Chandra Source Catalog, provided by the Chandra X-ray Center (CXC) as part of the Chandra Data Archive. The authors thank the Russian Science Foundation (grant 19-12-00423) for financial support. VS also thanks Deutsche Forschungsgemeinschaft (DFG) for financial support (grant WE 1312/51-1). We also acknowledge the support from the Academy of Finland travel grants 331951 (ST, JM), the Vilho, Yrjö and Kalle Väisälä Foundation (ST, JM), the German Academic Exchange Service (DAAD) travel grant 57525212 (VD, VS, LJ). JL appreciates the support from the National Natural Science Foundation of China under Grants 11733009 and U1938103.
References
- Augusteijn, T., Greiner, J., Kouveliotou, C., et al. 1997, ApJ, 486, 1013 [NASA ADS] [CrossRef] [Google Scholar]
- Beloborodov, A. M. 2002, ApJ, 566, L85 [Google Scholar]
- Bildsten, L., & Brown, E. F. 1997, ApJ, 477, 897 [NASA ADS] [CrossRef] [Google Scholar]
- Bildsten, L., Chakrabarty, D., Chiu, J., et al. 1997, ApJS, 113, 367 [NASA ADS] [CrossRef] [Google Scholar]
- Brazier, K. T. S. 1994, MNRAS, 268, 709 [NASA ADS] [Google Scholar]
- Campana, S., Stella, L., Mereghetti, S., & de Martino, D. 2018, A&A, 610, A46 [NASA ADS] [CrossRef] [EDP Sciences] [Google Scholar]
- Corbet, R. H. D. 1996, ApJ, 457, L31 [NASA ADS] [CrossRef] [Google Scholar]
- Court, J. M. C., Altamirano, D., Albayati, A. C., et al. 2018a, MNRAS, 481, 2273 [NASA ADS] [CrossRef] [Google Scholar]
- Court, J. M. C., Altamirano, D., & Sanna, A. 2018b, MNRAS, 477, L106 [CrossRef] [Google Scholar]
- Cui, W. 1997, ApJ, 482, L163 [NASA ADS] [CrossRef] [Google Scholar]
- D’Aì, A., Di Salvo, T., Iaria, R., et al. 2015, MNRAS, 449, 4288 [NASA ADS] [CrossRef] [Google Scholar]
- Daigne, F., Goldoni, P., Ferrando, P., et al. 2002, A&A, 386, 531 [NASA ADS] [CrossRef] [EDP Sciences] [Google Scholar]
- Degenaar, N., Miller, J. M., Harrison, F. A., et al. 2014, ApJ, 796, L9 [NASA ADS] [CrossRef] [Google Scholar]
- de Jager, O. C., Raubenheimer, B. C., & Swanepoel, J. W. H. 1989, A&A, 221, 180 [NASA ADS] [Google Scholar]
- Doroshenko, V., Santangelo, A., Kreykenbohm, I., & Doroshenko, R. 2012, A&A, 540, L1 [NASA ADS] [CrossRef] [EDP Sciences] [Google Scholar]
- Doroshenko, R., Santangelo, A., Doroshenko, V., Suleimanov, V., & Piraino, S. 2015a, MNRAS, 452, 2490 [NASA ADS] [CrossRef] [Google Scholar]
- Doroshenko, V., Santangelo, A., & Ducci, L. 2015b, A&A, 579, A22 [NASA ADS] [CrossRef] [EDP Sciences] [Google Scholar]
- Evans, I. N., Primini, F. A., Glotfelty, K. J., et al. 2010, ApJS, 189, 37 [NASA ADS] [CrossRef] [EDP Sciences] [Google Scholar]
- Finger, M. H. 2004, in X-ray Timing 2003: Rossi and Beyond, eds. P. Kaaret, F. K. Lamb, & J. H. Swank, AIP Conf. Ser., 714, 342 [CrossRef] [Google Scholar]
- Finger, M. H., Wilson, R. B., Harmon, B. A., Hagedon, K., & Prince, T. A. 1996a, IAU Circ., 6285, 1 [Google Scholar]
- Finger, M. H., Koh, D. T., Nelson, R. W., et al. 1996b, Nature, 381, 291 [NASA ADS] [CrossRef] [Google Scholar]
- Fishman, G. J., Kouveliotou, C., van Paradijs, J., et al. 1995, IAU Circ., 6272, 1 [Google Scholar]
- Fox, D., Kommers, J., Lewin, W., et al. 1998, BAAS, 191, 126.03 [Google Scholar]
- Gaia Collaboration (Brown, A. G. A., et al.) 2018, A&A, 616, A1 [NASA ADS] [CrossRef] [EDP Sciences] [Google Scholar]
- Garmire, G. P., Bautz, M. W., Ford, P. G., Nousek, J. A., & Ricker, G. R., Jr. 2003, in Society of Photo-Optical Instrumentation Engineers (SPIE) Conference Series, eds. J. E. Truemper, & H. D. Tananbaum, Proc. SPIE, 4851, 28 [Google Scholar]
- Gosling, A. J., Bandyopadhyay, R. M., Miller-Jones, J. C. A., & Farrell, S. A. 2007, MNRAS, 380, 1511 [NASA ADS] [CrossRef] [Google Scholar]
- Hoffman, J. A., Marshall, H. L., & Lewin, W. H. G. 1978, Nature, 271, 630 [NASA ADS] [CrossRef] [Google Scholar]
- Illarionov, A. F., & Sunyaev, R. A. 1975, A&A, 39, 185 [NASA ADS] [Google Scholar]
- Jahoda, K., Swank, J. H., Giles, A. B., et al. 1996, in In-Orbit Performance and Calibration of the Rossi X-ray Timing Explorer (RXTE) Proportional Counter Array (PCA), eds. O. H. Siegmund, & M. A. Gummin, SPIE Conf. Ser., 2808, 59 [Google Scholar]
- Jansen, F., Lumb, D., Altieri, B., et al. 2001, A&A, 365, L1 [NASA ADS] [CrossRef] [EDP Sciences] [Google Scholar]
- Ji, L., Santangelo, A., Zhang, S., et al. 2019, MNRAS, 482, 1110 [NASA ADS] [CrossRef] [Google Scholar]
- Kouveliotou, C., Kommers, J., Lewin, W. H. G., et al. 1996, IAU Circ., 6286, 1 [Google Scholar]
- Minniti, D., Lucas, P. W., Emerson, J. P., et al. 2010, New Astron., 15, 433 [Google Scholar]
- Mönkkönen, J., Tsygankov, S. S., Mushtukov, A. A., et al. 2019, A&A, 626, A106 [CrossRef] [EDP Sciences] [Google Scholar]
- Mushtukov, A. A., Suleimanov, V. F., Tsygankov, S. S., & Poutanen, J. 2015, MNRAS, 447, 1847 [NASA ADS] [CrossRef] [Google Scholar]
- Nishiuchi, M., Koyama, K., Maeda, Y., et al. 1999, ApJ, 517, 436 [NASA ADS] [CrossRef] [Google Scholar]
- Rappaport, S., & Joss, P. C. 1997, ApJ, 486, 435 [NASA ADS] [CrossRef] [Google Scholar]
- Rosen, S. R., Webb, N. A., Watson, M. G., et al. 2016, A&A, 590, A1 [NASA ADS] [CrossRef] [EDP Sciences] [Google Scholar]
- Sanna, A., Riggio, A., Burderi, L., et al. 2017, MNRAS, 469, 2 [NASA ADS] [CrossRef] [Google Scholar]
- Shakura, N. I., & Sunyaev, R. A. 1973, A&A, 500, 33 [NASA ADS] [Google Scholar]
- Stark, M. J., Jahoda, K., & Lipski, W. J. 1998, Am. Astron. Soc. Meet. Abstr., 192, 68.03 [Google Scholar]
- Stella, L., White, N. E., & Rosner, R. 1986, ApJ, 308, 669 [NASA ADS] [CrossRef] [Google Scholar]
- Strüder, L., Briel, U., Dennerl, K., et al. 2001, A&A, 365, L18 [NASA ADS] [CrossRef] [EDP Sciences] [Google Scholar]
- Suleimanov, V. F., Lipunova, G. V., & Shakura, N. I. 2007, Astron. Rep., 51, 549 [NASA ADS] [CrossRef] [Google Scholar]
- Suleimanov, V. F., Poutanen, J., Nättilä, J., et al. 2017, MNRAS, 466, 906 [NASA ADS] [CrossRef] [Google Scholar]
- Suleimanov, V. F., Poutanen, J., & Werner, K. 2018, A&A, 619, A114 [NASA ADS] [CrossRef] [EDP Sciences] [Google Scholar]
- Tsygankov, S. S., Mushtukov, A. A., Suleimanov, V. F., & Poutanen, J. 2016, MNRAS, 457, 1101 [NASA ADS] [CrossRef] [Google Scholar]
- Tsygankov, S. S., Mushtukov, A. A., Suleimanov, V. F., et al. 2017a, A&A, 608, A17 [NASA ADS] [CrossRef] [EDP Sciences] [Google Scholar]
- Tsygankov, S. S., Wijnands, R., Lutovinov, A. E. A., Degenaar, N., & Poutanen, J. 2017b, MNRAS, 470, 126 [NASA ADS] [CrossRef] [Google Scholar]
- Tsygankov, S. S., Doroshenko, V., Mushtukov, A. E. A., et al. 2019a, MNRAS, 487, L30 [CrossRef] [Google Scholar]
- Tsygankov, S. S., Rouco Escorial, A., Suleimanov, V. F., et al. 2019b, MNRAS, 483, L144 [NASA ADS] [CrossRef] [Google Scholar]
- Turner, M. J. L., Abbey, A., Arnaud, M., et al. 2001, A&A, 365, L27 [NASA ADS] [CrossRef] [EDP Sciences] [Google Scholar]
- Watson, M. G., Schröder, A. C., Fyfe, D., et al. 2009, A&A, 493, 339 [NASA ADS] [CrossRef] [EDP Sciences] [Google Scholar]
- Weisskopf, M. C., Tananbaum, H. D., Van Speybroeck, L. P., & O’Dell, S. L. 2000, in Society of Photo-Optical Instrumentation Engineers (SPIE) Conference Series, eds. J. E. Truemper, & B. Aschenbach, Proc. SPIE, 4012, 2 [Google Scholar]
- Weisskopf, M. C., Ramsey, B., O’Dell, S., et al. 2016, in Space Telescopes and Instrumentation 2016: Ultraviolet to Gamma Ray, SPIE Conf. Ser., 9905, 990517 [CrossRef] [Google Scholar]
- Wijnands, R., & Wang, Q. D. 2002, ApJ, 568, L93 [NASA ADS] [CrossRef] [Google Scholar]
- Woods, P. M., Kouveliotou, C., van Paradijs, J., et al. 1999, ApJ, 517, 431 [NASA ADS] [CrossRef] [Google Scholar]
- Woods, P. M., Kouveliotou, C., van Paradijs, J., et al. 2000, ApJ, 540, 1062 [CrossRef] [Google Scholar]
- Younes, G., Kouveliotou, C., Grefenstette, B. W., et al. 2015, ApJ, 804, 43 [NASA ADS] [CrossRef] [Google Scholar]
- Zhang, S. N., Feroci, M., Santangelo, A., et al. 2016, in Space Telescopes and Instrumentation 2016: Ultraviolet to Gamma Ray, SPIE Conf. Ser., 9905, 99051Q [CrossRef] [Google Scholar]
All Tables
Best-fit parameters for GRO J1744–28 spectrum as observed with XMM-Newton (obsid. 0821120101) and described with an absorbed blackbody (BB), power law (PL), and accretion-heated atmosphere (ATM) models.
All Figures
|
Fig. 1. Deep stack Ks band image from the VVV survey (Minniti et al. 2010). Location of the two counterparts (labeled a and b in the picture with respective uncertainties indicated by circle radii) suggested by Gosling et al. (2007) with X-ray positions of GRO J1744–28, reported by Wijnands & Wang (2002), and in the CSC 2.0 catalog (blue), the 4XMM-DR9 catalog (thin red lines), and as obtained in this work (thick red line). The white contours indicate 1 − 3σ confidence levels from the joint fit of all aforementioned X-ray positions obtained as described in the text. |
| In the text | |
|
Fig. 2. Light curve of GRO J1744–28 with time resolution of 1 ks as observed by XMM-Newton in the 0.5−10 keV energy band (all detectors combined) reveals strong flux variability. |
| In the text | |
|
Fig. 3. Historical light curve of GRO J1744–28 as observed by XMM-Newton (black points) and Chandra (blue points for HRC and red for ACIS-S cameras). Here, the bolometric luminosity estimated, assuming a distance to the source of 8 kpc and a bolometric correction factor of 3.7, is also indicated. The shaded area indicates the 2014 outburst of the source. The dotted line indicates the propeller luminosity estimated in this work. |
| In the text | |
|
Fig. 4. Periodogram for EPIC PN data in 2−7 keV energy range. The shaded area represents the historically reported period range. |
| In the text | |
|
Fig. 5. Best-fit unfolded spectrum (with absorbed blackbody model, top), and corresponding residuals for fits with absorbed blackbody (BB), power law (PL), and accretion heated atmosphere (AHATM) models. |
| In the text | |
|
Fig. 6. Spectra of the computed accretion heated atmospheres (top panel) and the corresponding temperature structures. The grid models with the relative accretion luminosities La/LEdd = 0.1,0.2,0.3, and 0.4 are shown with blue curves. The best fit model spectra and temperature structure are shown with red curves. The best fit diluted blackbody spectrum in the NS surface frame ( |
| In the text | |
|
Fig. 7. Evolution of spectral hardness reported in the XMM SSC catalog for GRO J1744–28 (HR3 field) as a function of flux. |
| In the text | |
|
Fig. 8. Estimates of the magnetospheric radius published in the literature (black points, see text for references) and obtained in this work (red circle) as a function of luminosity. Theoretical estimates of the magnetospheric radii for dipole Rm, dip, assuming ξ = 0.49 and μ30 = 0.43 (Campana et al. 2018), and quadrupole Rm, quad with ξ = 0.8 and μ30 = 0.43 (Mönkkönen et al. 2019), corotation radius Rc and estimated luminosities for the propeller transition obtained in this work and by Campana et al. (2018; black dotted lines) are also shown. |
| In the text | |
Current usage metrics show cumulative count of Article Views (full-text article views including HTML views, PDF and ePub downloads, according to the available data) and Abstracts Views on Vision4Press platform.
Data correspond to usage on the plateform after 2015. The current usage metrics is available 48-96 hours after online publication and is updated daily on week days.
Initial download of the metrics may take a while.