Fig. 6.
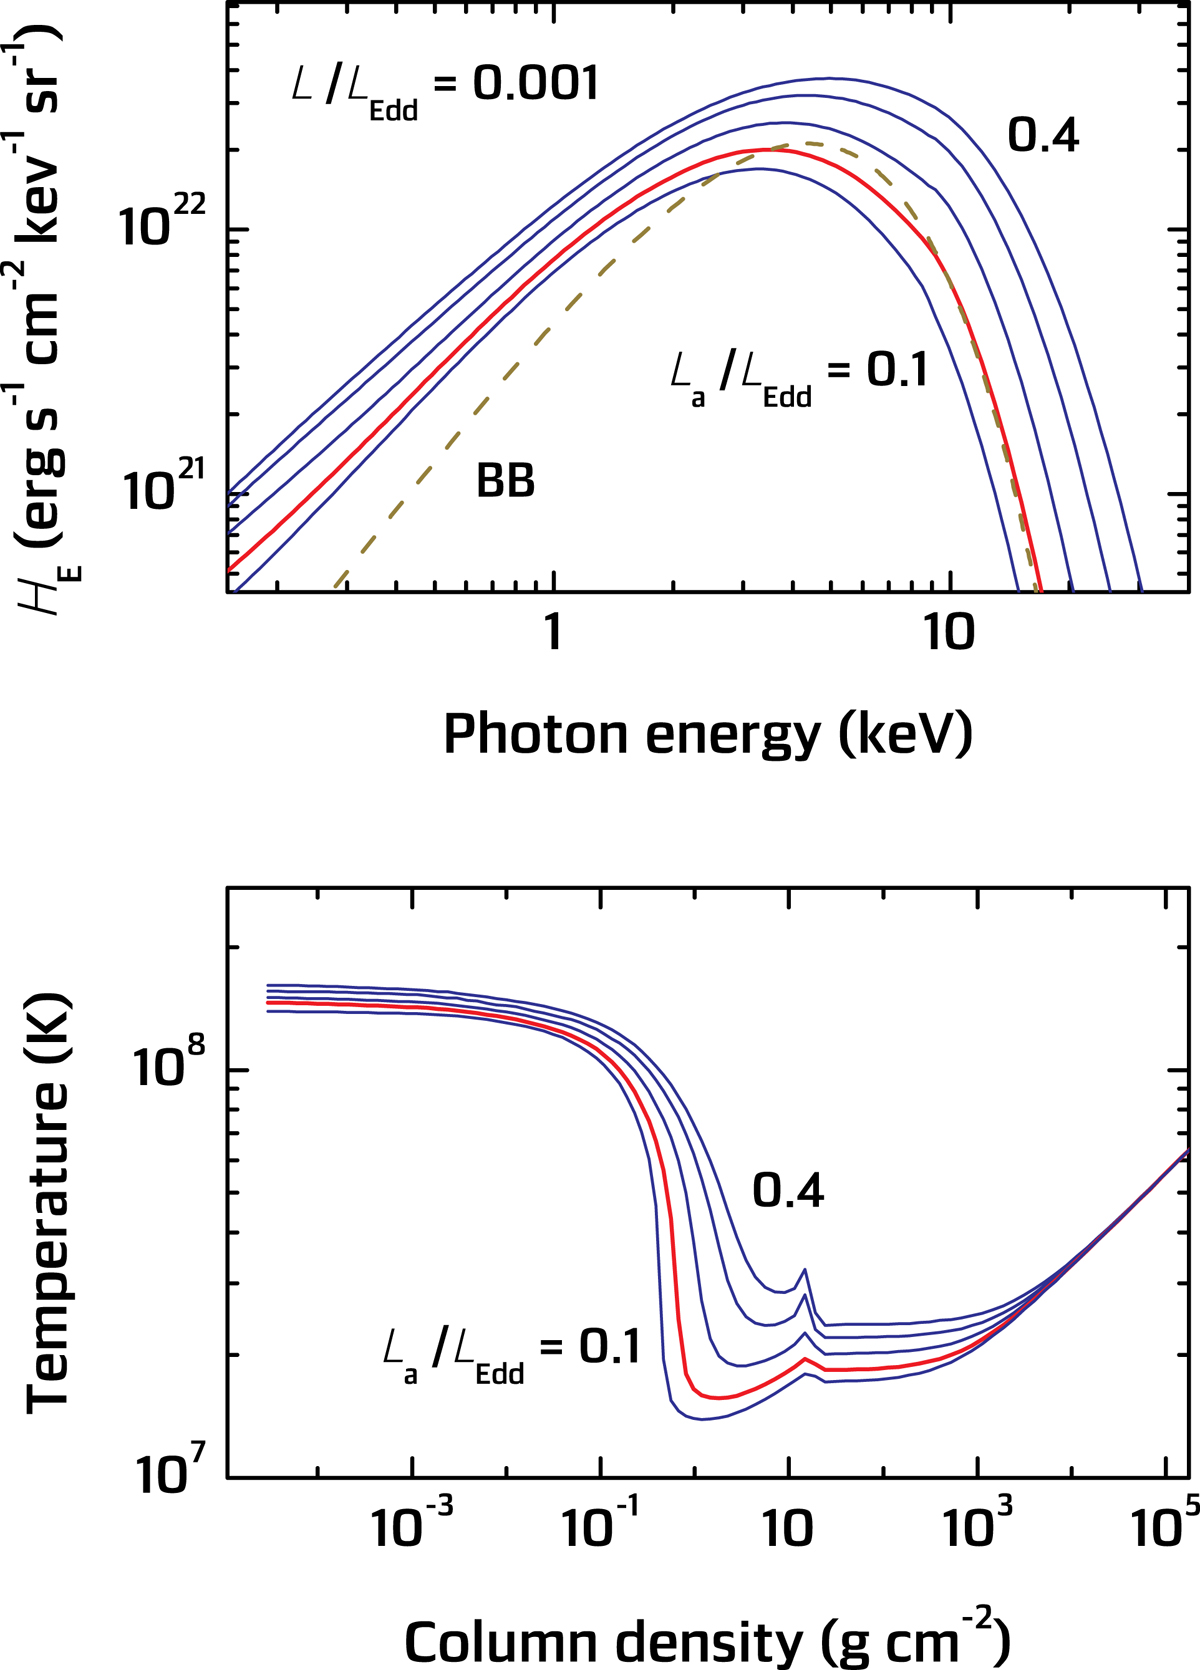
Spectra of the computed accretion heated atmospheres (top panel) and the corresponding temperature structures. The grid models with the relative accretion luminosities La/LEdd = 0.1,0.2,0.3, and 0.4 are shown with blue curves. The best fit model spectra and temperature structure are shown with red curves. The best fit diluted blackbody spectrum in the NS surface frame (![]() = 1.545 keV) is also shown with a dashed curve.
= 1.545 keV) is also shown with a dashed curve.
Current usage metrics show cumulative count of Article Views (full-text article views including HTML views, PDF and ePub downloads, according to the available data) and Abstracts Views on Vision4Press platform.
Data correspond to usage on the plateform after 2015. The current usage metrics is available 48-96 hours after online publication and is updated daily on week days.
Initial download of the metrics may take a while.