Fig. 25
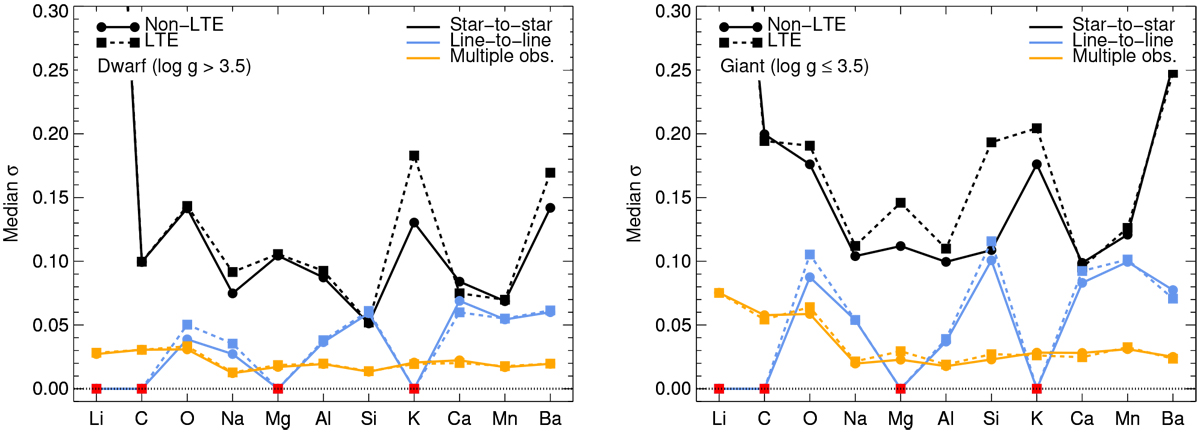
Dispersions in the abundance results, in non-LTE (solid) and LTE (dashed) for dwarfs (left; log g∕cm s−2 > 3.5) and giants (right; log g∕cm s−2 ≤ 3.5). “Multiple obs.” (orange) show median standard deviations in [A/Fe] over multiple observations of the same stars. “Line-to-line” (blue) show the median standard deviations in [A/Fe ] over multiple spectral lines for the same star; lithium, carbon, magnesium, and potassium in red are set to zero because they were inferred from single lines. “Star-to-star” (black) show the median standard deviation in [A/Fe ] (or in log ɛA, in the case of lithium) across the different bins shown in Figs. 14–24.
Current usage metrics show cumulative count of Article Views (full-text article views including HTML views, PDF and ePub downloads, according to the available data) and Abstracts Views on Vision4Press platform.
Data correspond to usage on the plateform after 2015. The current usage metrics is available 48-96 hours after online publication and is updated daily on week days.
Initial download of the metrics may take a while.