Fig. 6
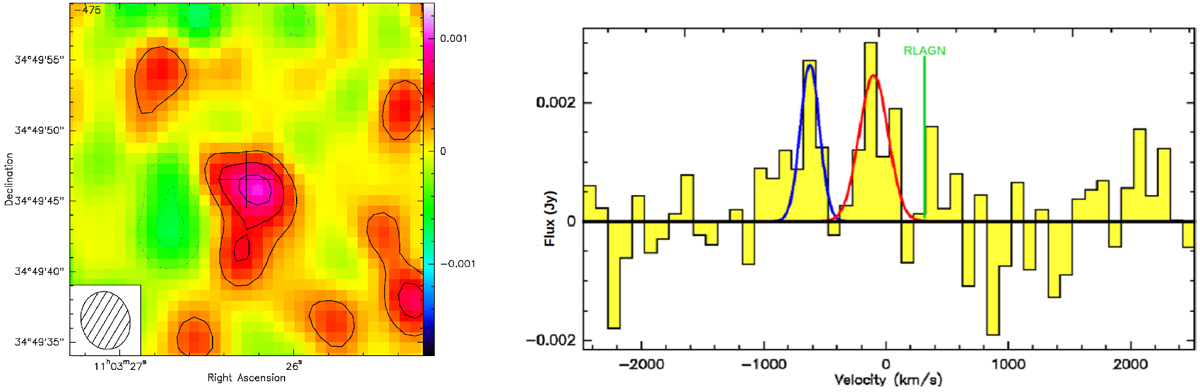
Left: zoom-in on the CO(2–1) line emission, continuum-subtracted mosaic map of the extended source in the cluster center. The black cross marks the center of our observations. The beam size (4.14 × 3.45 arcsec2) is plotted at the lower left. The color scale of the intensity map is in Jy beam−1. The rms noise level is σ ~ 0.2 mJy beam−1 in the central pointing intersection region. The contours correspond to the 1σ, 2σ, and 3σ levels. Right: CO(2–1) line emission integrated spectrum. The two Gaussian fits correspond to system velocities of Vsys =−623.0 km s−1 (blue) and Vsys = −115.5 km s−1 (red). The AGN spectroscopic redshift corresponds to a velocity of v = 331.6 km s−1 (vertical green line).
Current usage metrics show cumulative count of Article Views (full-text article views including HTML views, PDF and ePub downloads, according to the available data) and Abstracts Views on Vision4Press platform.
Data correspond to usage on the plateform after 2015. The current usage metrics is available 48-96 hours after online publication and is updated daily on week days.
Initial download of the metrics may take a while.