Fig. 7.
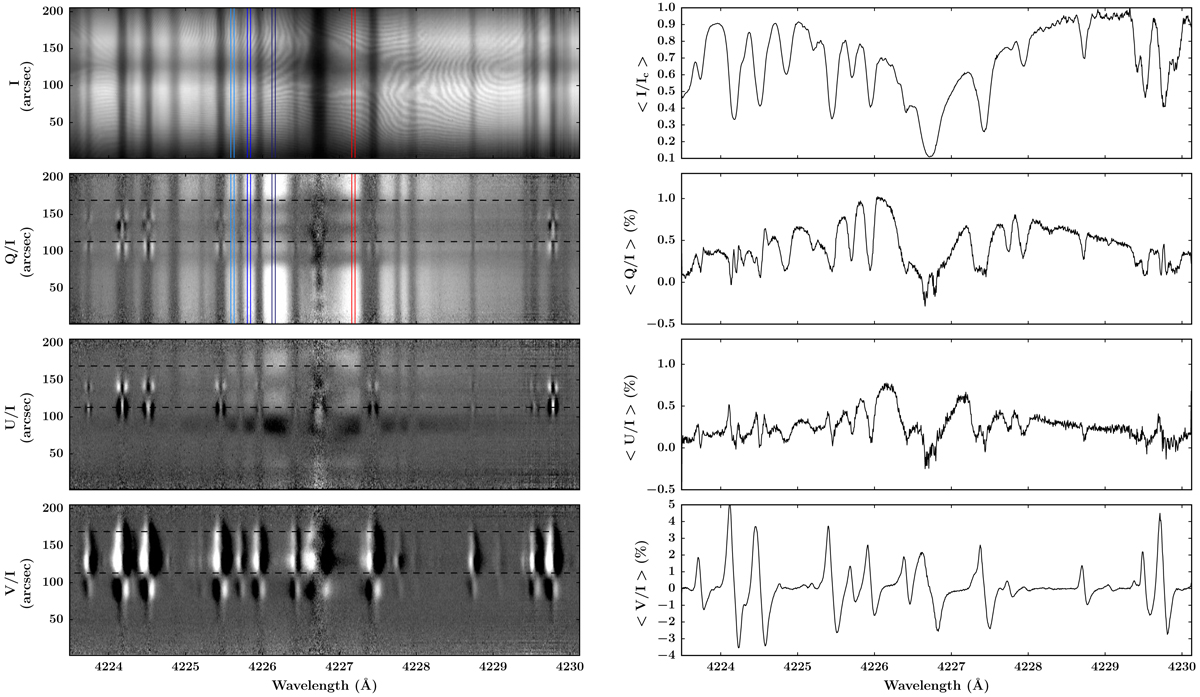
Stokes I, Q/I, U/I, and V/I images (left) and spatially averaged profiles (right). The spatial average was performed over the slit positions from ∼110″ to 170″ (dashed line) where the magnetic field is strongest. The intensity is normalized to the continuum. The observation was taken at a limb distance of 5″, across a solar region with stronger magnetic activity, with the slit oriented parallel to the nearest limb. The positive direction for Stokes Q is taken parallel to the limb. The wavelength intervals of interest are highlighted in the intensity and Q/I images.
Current usage metrics show cumulative count of Article Views (full-text article views including HTML views, PDF and ePub downloads, according to the available data) and Abstracts Views on Vision4Press platform.
Data correspond to usage on the plateform after 2015. The current usage metrics is available 48-96 hours after online publication and is updated daily on week days.
Initial download of the metrics may take a while.