Fig. 6.
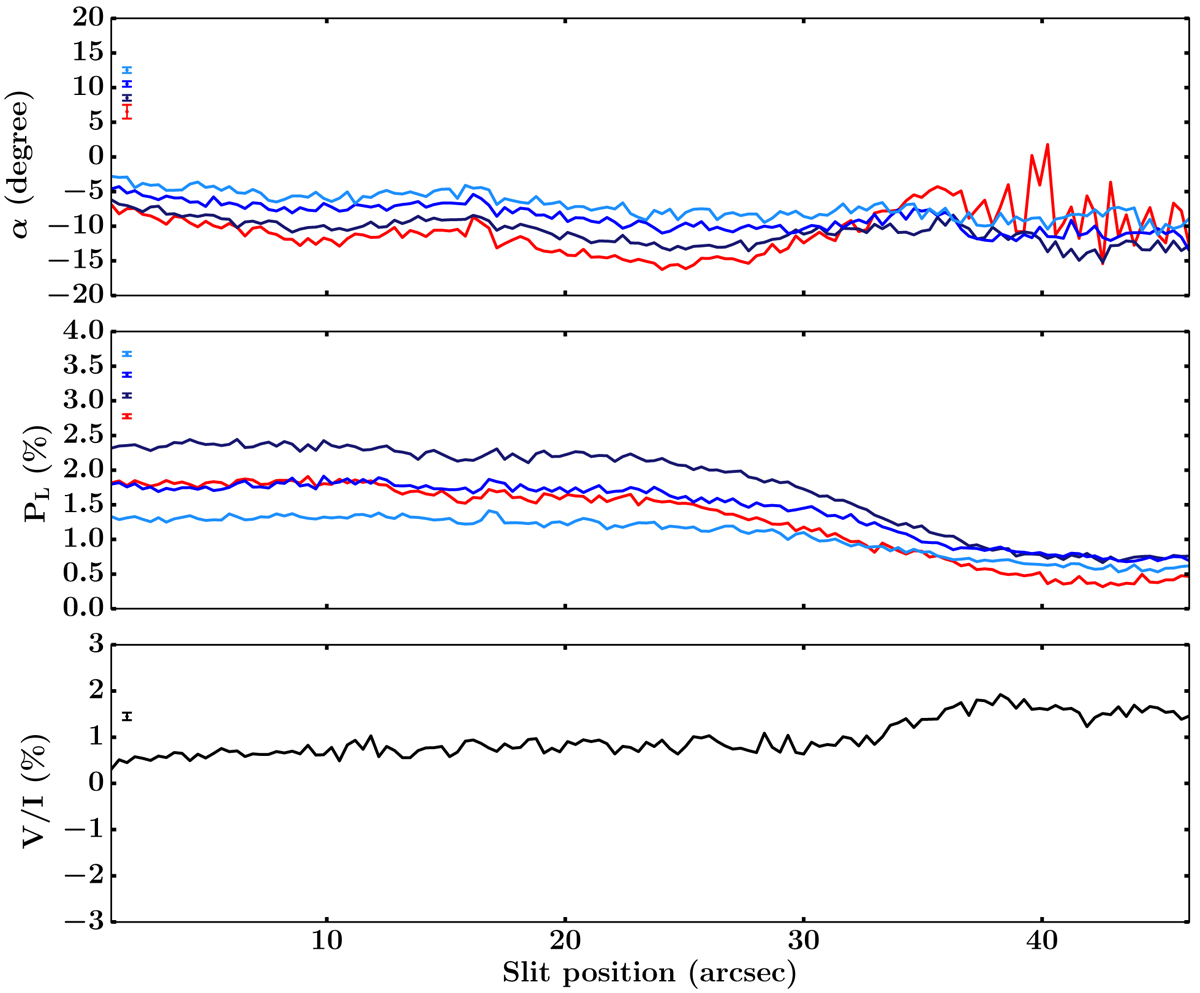
Linear polarization angle (upper panel) and total linear polarization fraction (middle panel) along the slit for the considered wavelength intervals (see text and Table 2). In the lower panel, the amplitude of the blue peak of the V/I signal in the Fe I 4224.2 Å line is shown as a function of the slit position. The values shown in all three panels are obtained from the data presented in Fig. 5. The error bars (statistical error) are reported in the upper left of each panel.
Current usage metrics show cumulative count of Article Views (full-text article views including HTML views, PDF and ePub downloads, according to the available data) and Abstracts Views on Vision4Press platform.
Data correspond to usage on the plateform after 2015. The current usage metrics is available 48-96 hours after online publication and is updated daily on week days.
Initial download of the metrics may take a while.