Fig. 9.
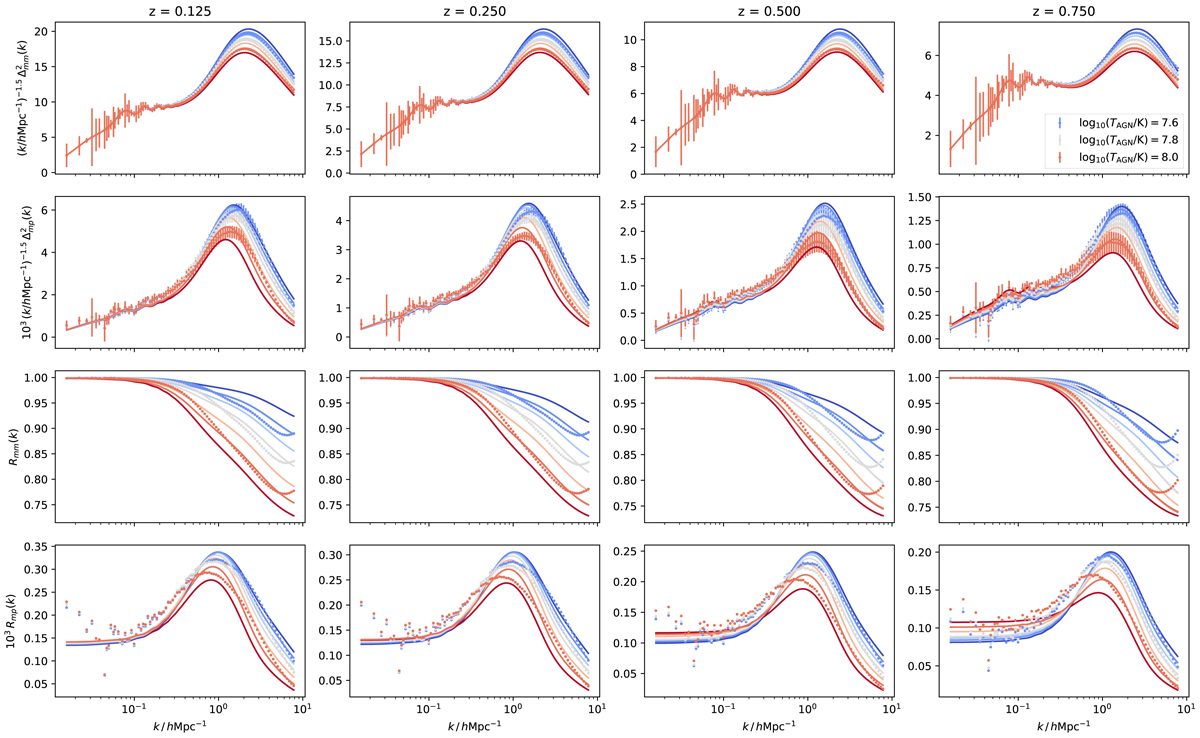
Same as Figs. 7 and 8, but for model (3) for the matter–matter (first and third row; power and response) and matter–electron pressure spectra (second and fourth row; power and response). The match to the matter–matter spectra is slightly degraded compared to the case when we fitted the matter–matter spectra exclusively, but we still match the response at the few percent level while simultaneously we match the matter–electron pressure spectrum well for k > 1 h Mpc−1. If we compare this to the error bars in the power spectra in the second row we see that our fit is good for scales where the three AGN heating temperature strengths are clearly demarcated in k. At larger scales we suspect the larger errors arise because the power is predominantly coming from few massive haloes. Similar to Fig. 8, we show how the model fares outside the range of AGN strengths to which is was fitted. AGN heating temperature is shown in 0.1 dex intervals between 107.5 K and 108.1 K, while the model was fitted between 107.6 K and 108.0 K, thus demonstrating that our model is robust to extrapolation.
Current usage metrics show cumulative count of Article Views (full-text article views including HTML views, PDF and ePub downloads, according to the available data) and Abstracts Views on Vision4Press platform.
Data correspond to usage on the plateform after 2015. The current usage metrics is available 48-96 hours after online publication and is updated daily on week days.
Initial download of the metrics may take a while.