Fig. 8.
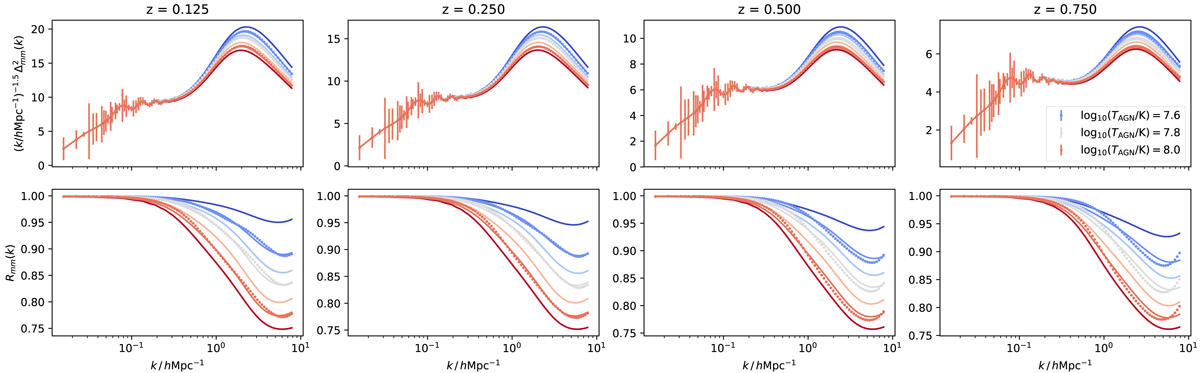
Similar to Fig. 7, but for the matter–matter spectrum (2). The power spectra are shown in the top row, while the response functions are shown in the bottom row. We see that the model is nearly perfect (errors at the sub-percent level) across a wide range of scales and for the different feedback scenarios. We see that the amount of power-spectrum suppression increases with the feedback temperature. The critical parameter that governs this in our modelling is the halo mass M0, which governs the halo mass below which more than half of the cosmic baryon density is missing from the halo. In the fitting parameters we see a strong preference for higher values of M0 for stronger feedback temperatures (from blue to red). How our model fares outside the range of AGN heating temperatures to which it was fitted is also shown via the lines that have no corresponding simulation points. To generate these we have interpolated and extrapolated our model parameters as a function of AGN heating temperature, which is shown in 0.1 dex intervals between 107.5 (bluest) and 108.1 K (reddest), indicating that our model is robust to extrapolation.
Current usage metrics show cumulative count of Article Views (full-text article views including HTML views, PDF and ePub downloads, according to the available data) and Abstracts Views on Vision4Press platform.
Data correspond to usage on the plateform after 2015. The current usage metrics is available 48-96 hours after online publication and is updated daily on week days.
Initial download of the metrics may take a while.