Fig. 7.
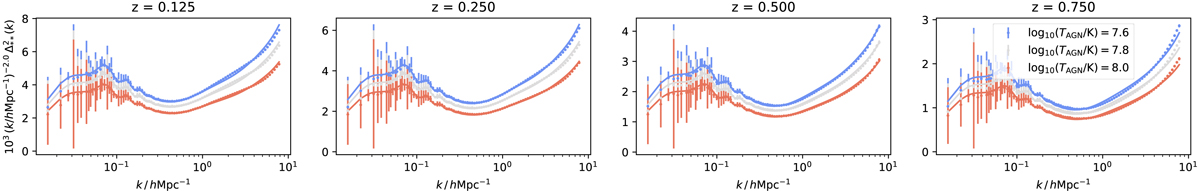
Halo model (1) for the star–star power spectrum is shown as sold lines while simulation measurements are shown as points with error bars that come from the scatter in power between three different realisations of the AGN BAHAMAS simulation. Note that the power spectra shown here is the measured response multiplied by HMCODE, so cosmic variance is removed at small scales, but we still show the error bar for comparison. Different colours denote the three different AGN feedback temperatures: 107.6 (blue), 107.8 (grey) and 108.0 K (red). Parameters for the model can be found in Table 2. We see that the spectrum is reduced in amplitude as feedback temperature increases, a consequence of AGN feedback suppressing star formation. This is reflected in the modelling as the value of A* and M* decreases as AGN strength increases.
Current usage metrics show cumulative count of Article Views (full-text article views including HTML views, PDF and ePub downloads, according to the available data) and Abstracts Views on Vision4Press platform.
Data correspond to usage on the plateform after 2015. The current usage metrics is available 48-96 hours after online publication and is updated daily on week days.
Initial download of the metrics may take a while.