Fig. 5.
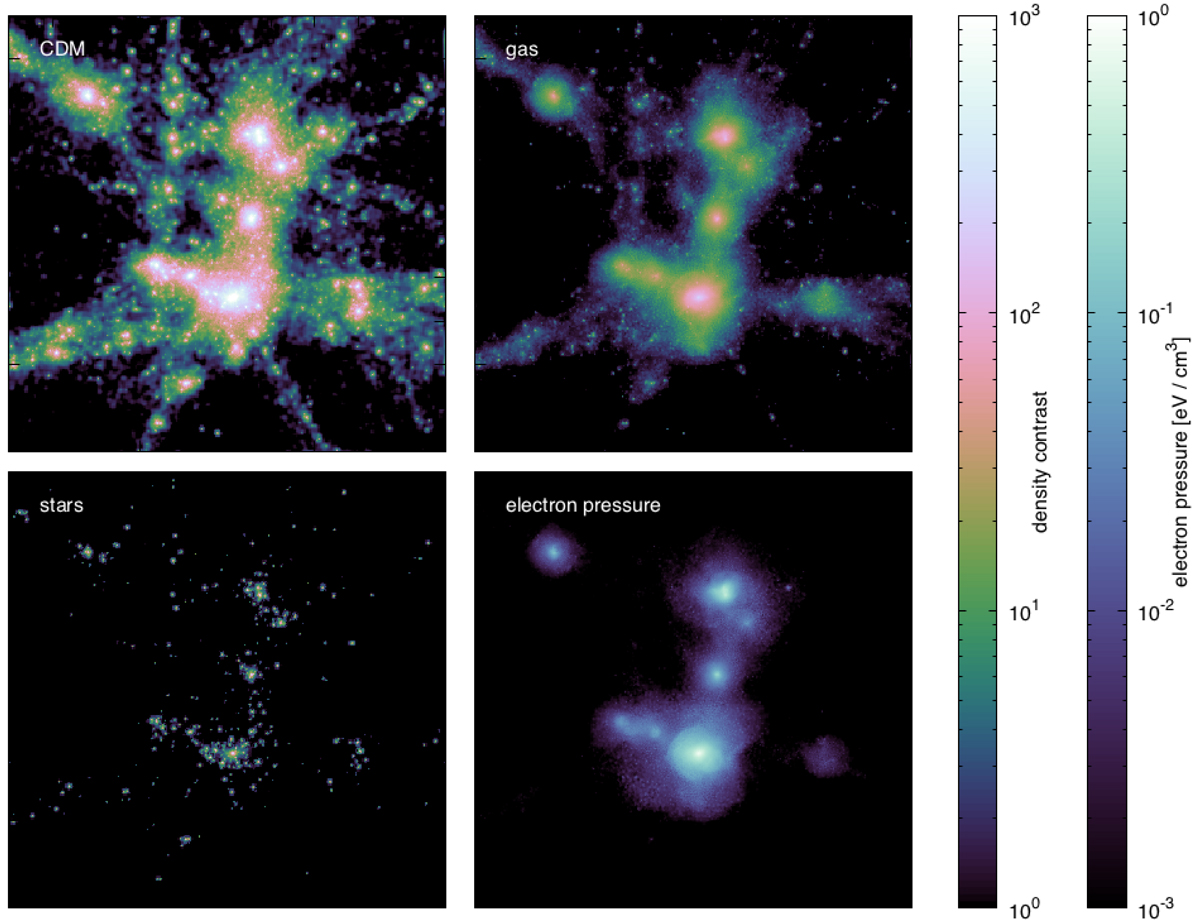
Different fields measured from the BAHAMAS AGN simulation at z = 0 around a M ∼ 1015 h−1 M⊙ halo averaged through a square slab of side 20 h−1 Mpc and thickness 5 h−1 Mpc. We show CDM (top left), gas (top right) and star (bottom left) density contrast as well as electron pressure (bottom right). Colour intensity increases with field value logarithmically and we show a dynamic range of 103 for both density contrast and electron pressure. We see that the gas is less clumped than the CDM and that low-mass sub haloes show a large gas depletion compared to the host. Stars are more tightly clustered in the halo centre than the CDM, but are absent in many of the substructures. The total matter density-contrast field would be a sum of the CDM, gas and star fields. The electron pressure broadly follows the gas but can only be seen emanating from the highest gas-density peaks over the dynamic range shown.
Current usage metrics show cumulative count of Article Views (full-text article views including HTML views, PDF and ePub downloads, according to the available data) and Abstracts Views on Vision4Press platform.
Data correspond to usage on the plateform after 2015. The current usage metrics is available 48-96 hours after online publication and is updated daily on week days.
Initial download of the metrics may take a while.