Fig. 3.
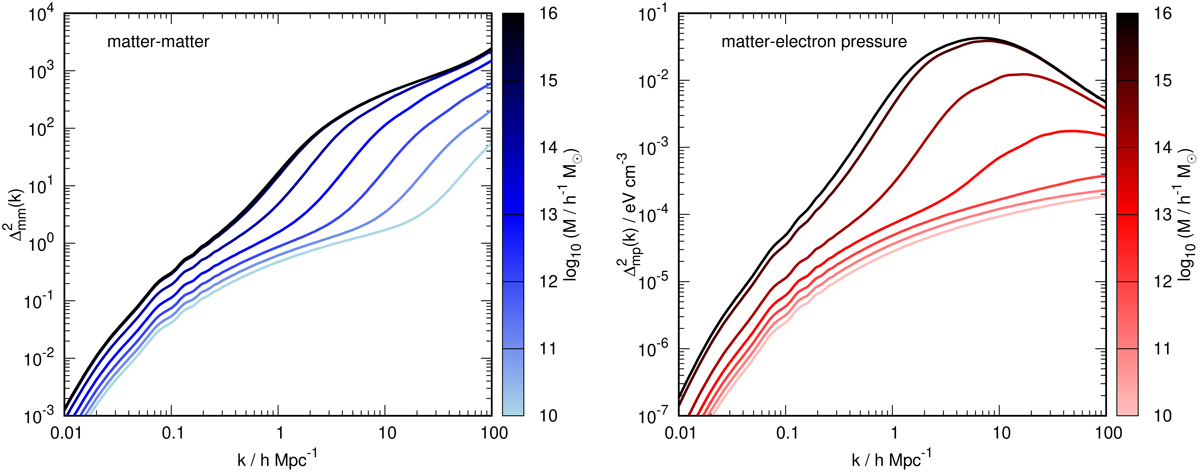
Cumulative halo model power spectra as a function of the upper-limit of halo mass at z = 0. Left-hand panel: matter–matter power spectrum as the upper limit is raised from 1010 to 1016 h−1 M⊙ (i.e. the lightest coloured curve shows the contribution from only haloes below 1010 h−1 M⊙), right-hand panel: same but for the matter–electron pressure spectrum. In both cases the converged spectrum from all halo masses is shown in thick black and this has been reached with an upper limit of 1016 h−1 M⊙. We see that the matter–matter spectrum builds up fairly gradually with halo mass and that all scales receive contributions from a wide range of halo masses. In contrast, the matter–electron pressure spectrum receives very little contribution from haloes less massive than 1013 h−1 M⊙, with the vast majority of the power coming from haloes between 1014 and 1015 h−1 M⊙.
Current usage metrics show cumulative count of Article Views (full-text article views including HTML views, PDF and ePub downloads, according to the available data) and Abstracts Views on Vision4Press platform.
Data correspond to usage on the plateform after 2015. The current usage metrics is available 48-96 hours after online publication and is updated daily on week days.
Initial download of the metrics may take a while.