Fig. C.10.
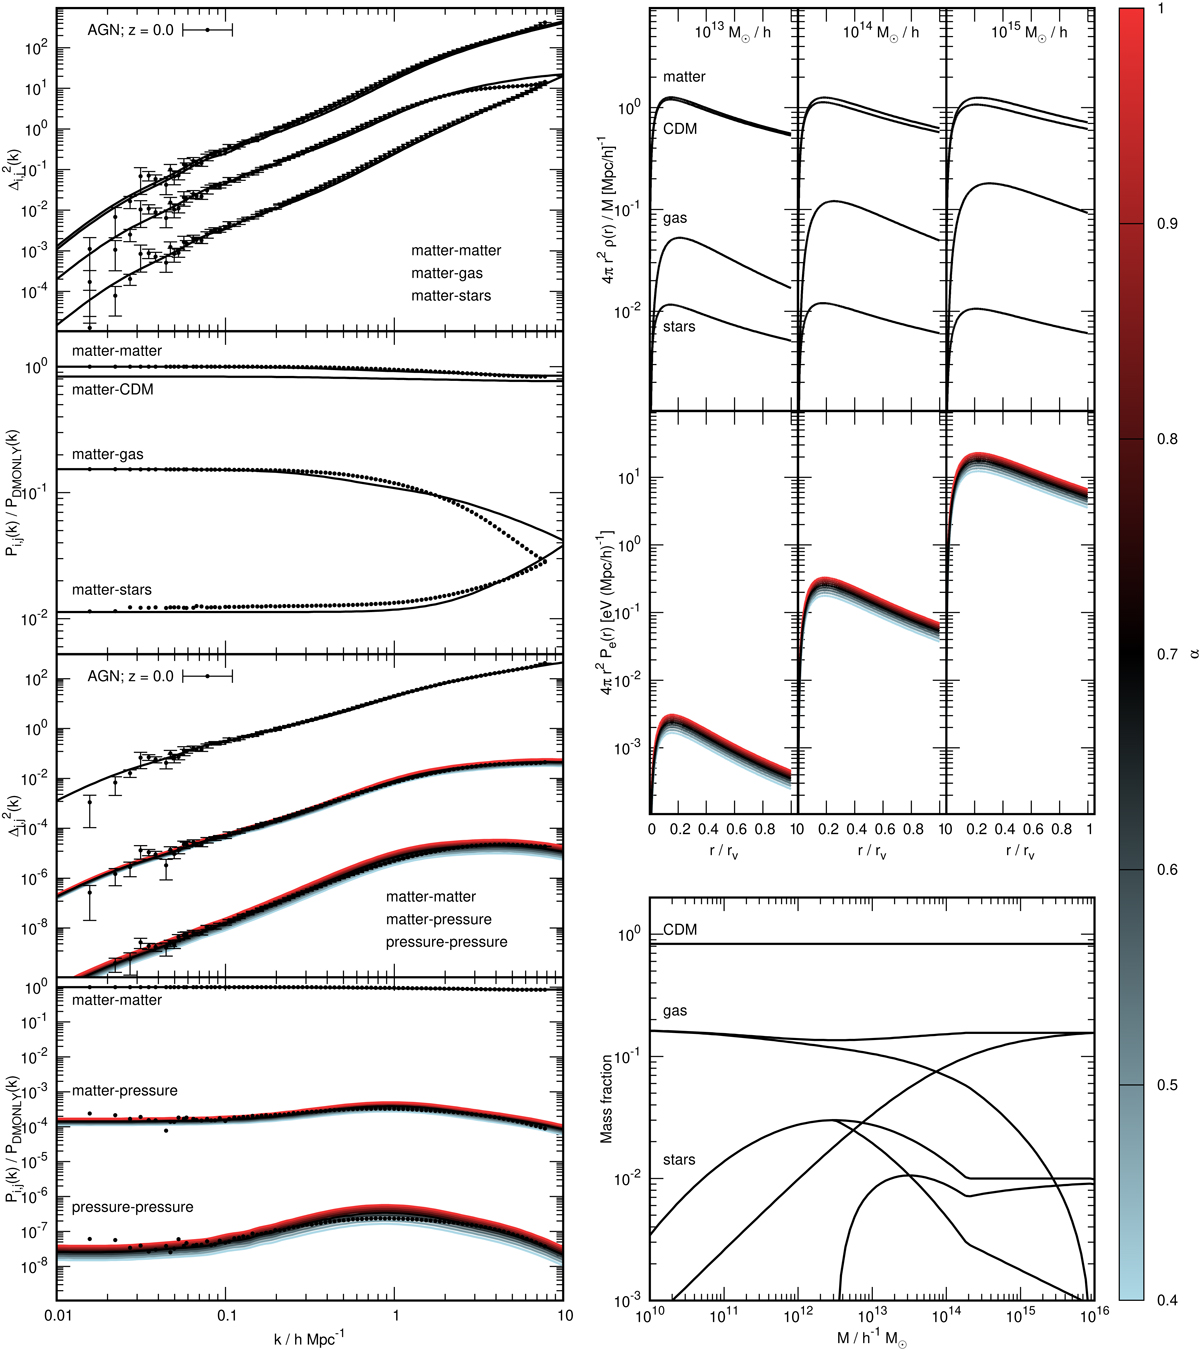
Same as Fig. C.1 but for α. α governs deviations of the halo temperature from the virial relation. We see that this affects the pressure profiles (middle right) by uniformly scaling the amplitude, because the pressure is directly proportional to temperature; increasing the temperature increases the pressure. We can see the effect of this on the pressure power spectra in the lower left two panels where the effect is not uniform due to the complicated dependence of the power spectra on the underlying halo populations in the two- and one-halo terms, which have different scalings with temperature.
Current usage metrics show cumulative count of Article Views (full-text article views including HTML views, PDF and ePub downloads, according to the available data) and Abstracts Views on Vision4Press platform.
Data correspond to usage on the plateform after 2015. The current usage metrics is available 48-96 hours after online publication and is updated daily on week days.
Initial download of the metrics may take a while.