Fig. C.9.
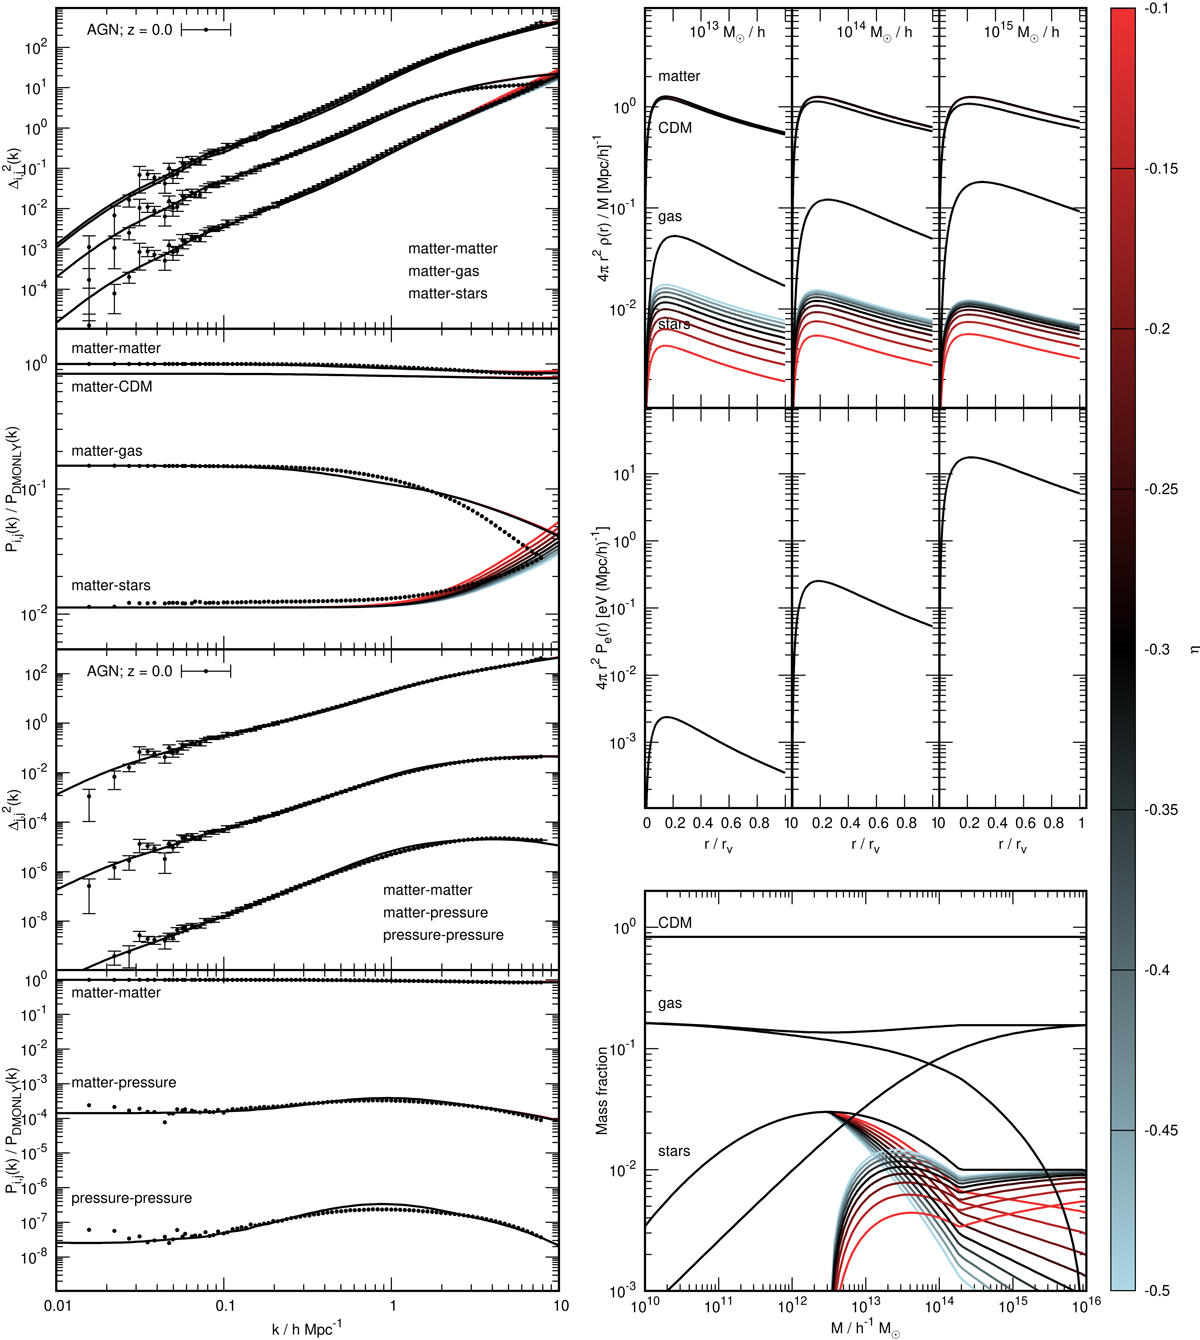
Same as Fig. C.1 but for η, which determines the split of stellar halo mass between central and satellite galaxies for M > M*, where M* = 1012.5 h−1 M⊙ in this figure. In the lower-right panel we see that increasing η from the fiducial −0.3 means that more mass is put into central galaxies, whereas decreasing it places more mass in satellites. As a result of this, the amplitude of the stellar halo is changed, as can be seen in the top-right panel, with decreasing η putting more mass into the NFW part of the profile and thus boosting the halo amplitude. This has a scale-dependent effect on the matter–stars power spectrum, as can be seen in the top-left two panels.
Current usage metrics show cumulative count of Article Views (full-text article views including HTML views, PDF and ePub downloads, according to the available data) and Abstracts Views on Vision4Press platform.
Data correspond to usage on the plateform after 2015. The current usage metrics is available 48-96 hours after online publication and is updated daily on week days.
Initial download of the metrics may take a while.