Fig. C.8.
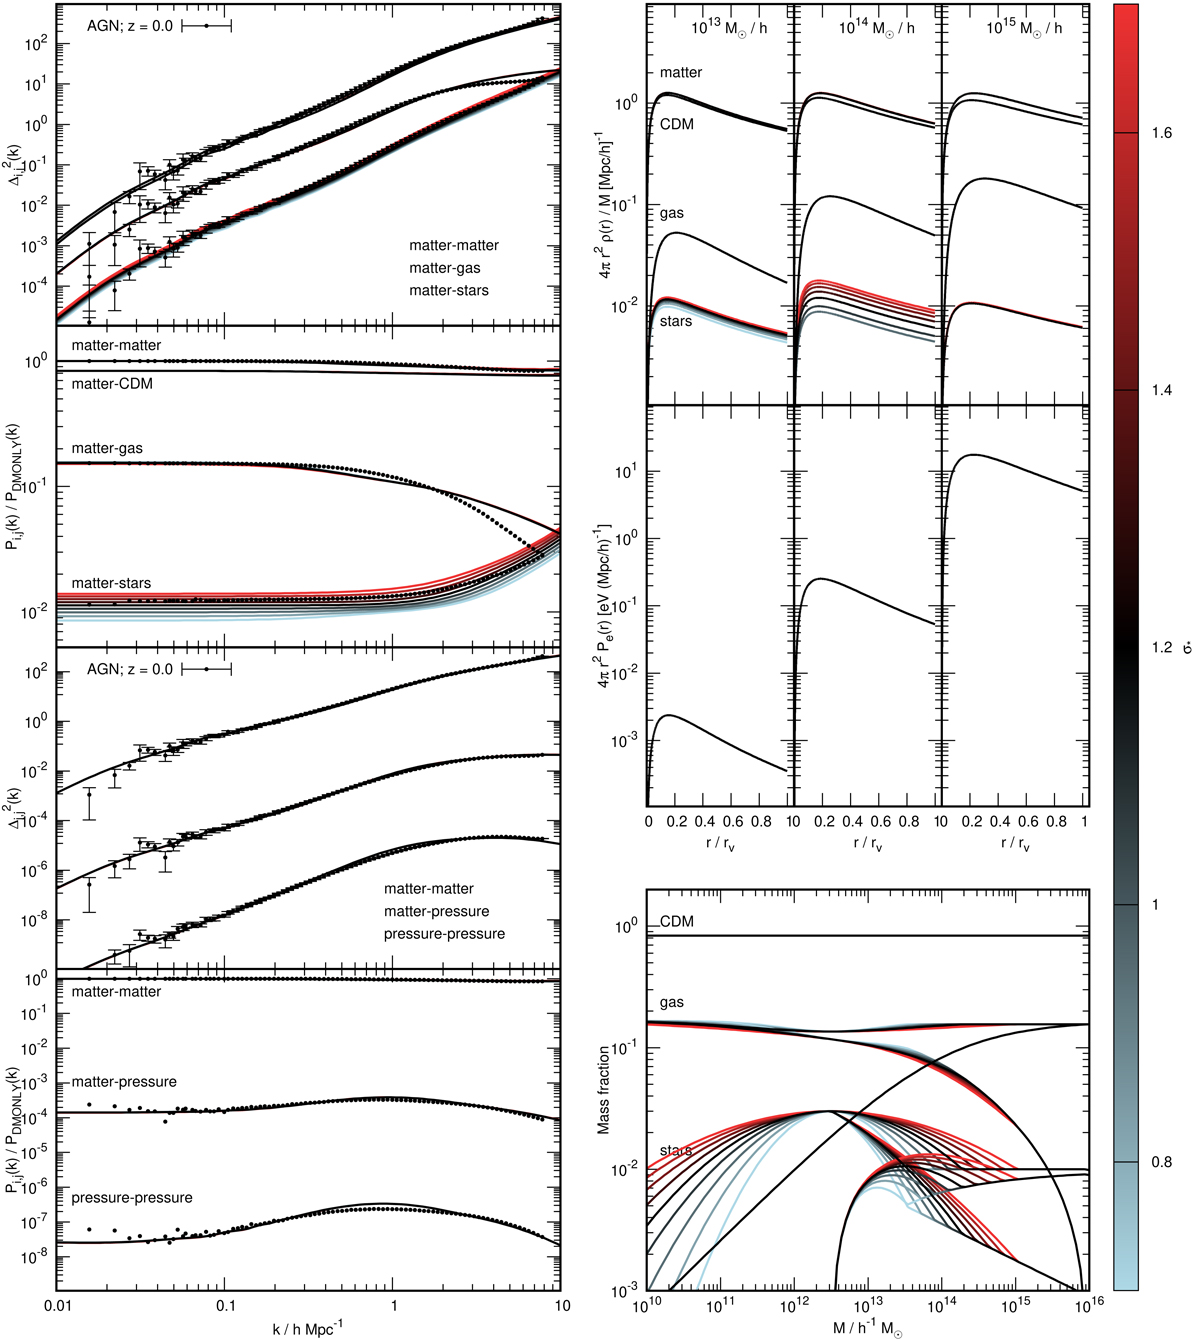
Same as Fig. C.1 but for σ*, which governs the width of the stellar-mass distribution around the peak (which is at M* = 1012.5 h−1 M⊙ here). As can be seen in the bottom-left panel, decreasing σ* shrinks the stellar-mass distribution, resulting in fewer stars in both higher and lower mass haloes than M*. The top-right panel shows that this has the biggest impact on 1014 h−1 M⊙ haloes, not higher-mass haloes due to the saturation we impose at high masses. In the left-hand panels we see that the effects of this are constrained to be on power spectra involving the stars. There is only a tiny effect on gas spectra which is due to baryonic mass conservation.
Current usage metrics show cumulative count of Article Views (full-text article views including HTML views, PDF and ePub downloads, according to the available data) and Abstracts Views on Vision4Press platform.
Data correspond to usage on the plateform after 2015. The current usage metrics is available 48-96 hours after online publication and is updated daily on week days.
Initial download of the metrics may take a while.