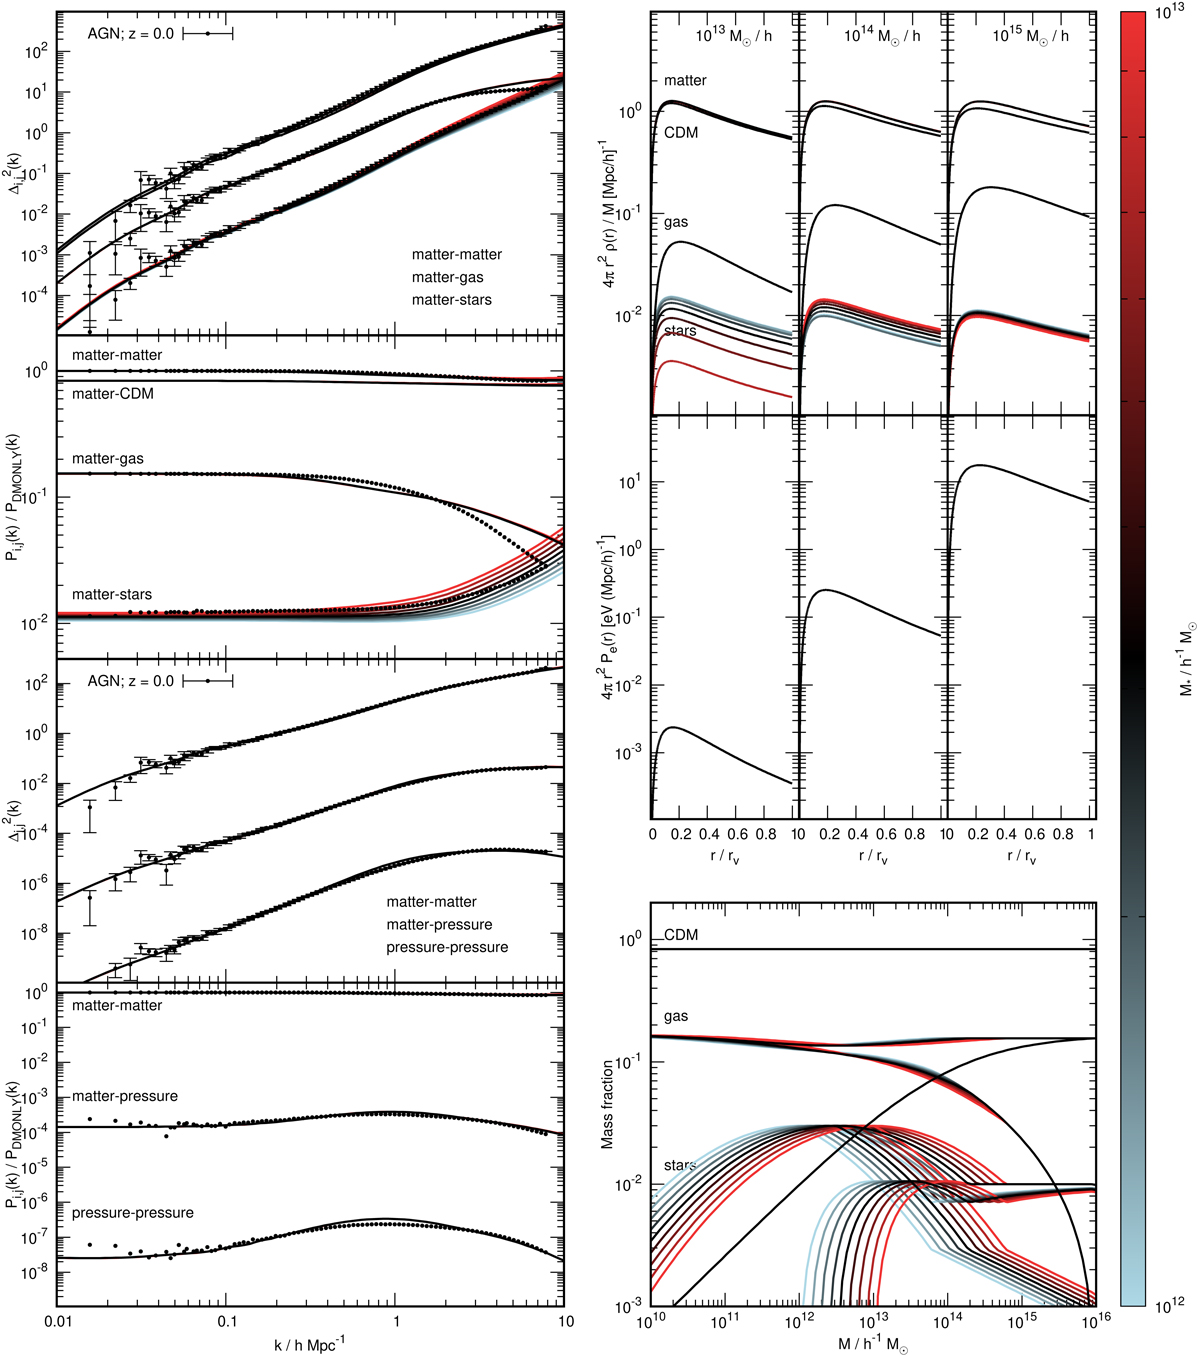
Fig. C.7.

Same as Fig. C.1 but for M*, the halo mass at which star formation efficiency peaks. Changing this parameter shifts the halo-stellar-mass fraction to lower and higher masses, as can be seen in the bottom-right panel, there is a small back-reaction effect on the gas abundance. Changing M* indirectly affects the halo profiles at different masses, as can be seen in the top right panel, but note that the delta-function component of the stellar halo profile is not shown in this plot. The power spectra involving stars are affects in a more scale-dependent manner as can be seen in the top-left two panels.
Current usage metrics show cumulative count of Article Views (full-text article views including HTML views, PDF and ePub downloads, according to the available data) and Abstracts Views on Vision4Press platform.
Data correspond to usage on the plateform after 2015. The current usage metrics is available 48-96 hours after online publication and is updated daily on week days.
Initial download of the metrics may take a while.


