Fig. 11.
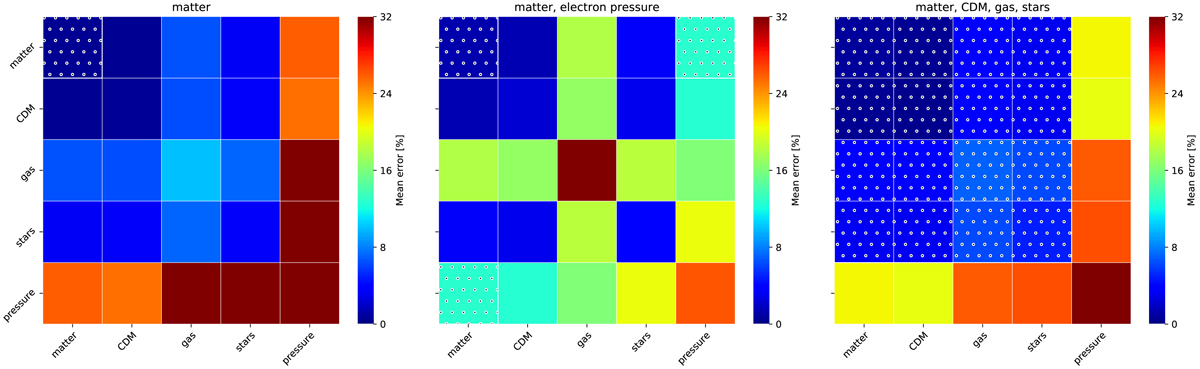
Full error matrix for our fitted models calculated for each field pair for the 107.8 K AGN simulation. The error is averaged linearly over redshift between z = 0 and 1 and over k logarithmically between ≃0.015 and 7 h Mpc−1. This matrix is symmetric because power spectra are symmetric when swapping the field labels. We show the matrix for the three models presented in this work: matter (2, left); matter, electron pressure (3, centre); matter, CDM, gas, stars (4, right). The squares that contain dots are the particular cross-spectra that are fitted in the model. In the left-hand plot, we see that in the matter model we get a reasonable fit to the power spectra all of the constituent fields. In the central plot we get a better match to to the matter–electron pressure spectrum than in the left-hand panel, but this is at the expense of any power spectra that directly involves the gas field, which shows some tension in our model between the gas and pressure modelling. In the right-hand panel, where we fitted matter, CDM, gas and stars, we see that all the matter spectra are reasonable, and better than in the left-hand panel, but achieving this is at the expense of any spectra that involves the pressure field.
Current usage metrics show cumulative count of Article Views (full-text article views including HTML views, PDF and ePub downloads, according to the available data) and Abstracts Views on Vision4Press platform.
Data correspond to usage on the plateform after 2015. The current usage metrics is available 48-96 hours after online publication and is updated daily on week days.
Initial download of the metrics may take a while.