Fig. 10.
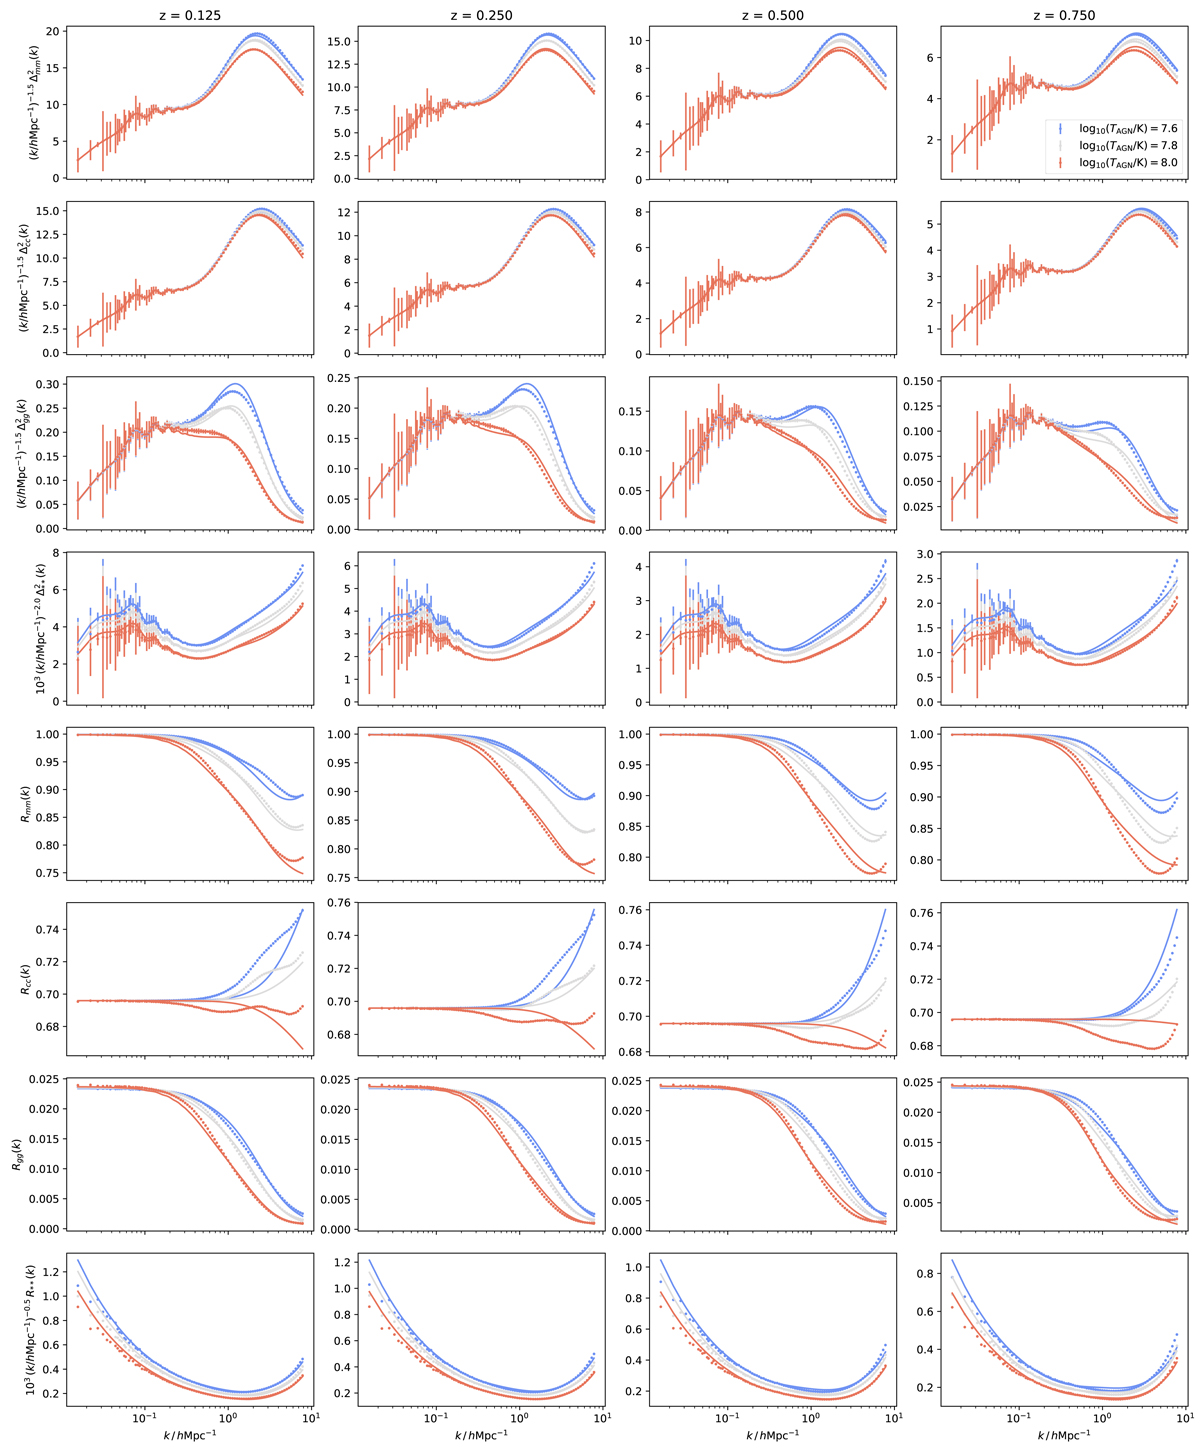
Same as Figs. 7–9, but for the best-fitting model (4) to all 10 possible power spectra of matter, CDM, gas and star fields, although we only show the 4 auto-spectra here. The top half of the figure show power spectra while the bottom half show response functions. Columns show different redshifts. Different colours are different feedback temperatures: T = 107.6 (blue), T = 107.8 (grey) and T = 108.0 K (red). Points (with errors) are from BAHAMAS while lines are from our halo model.
Current usage metrics show cumulative count of Article Views (full-text article views including HTML views, PDF and ePub downloads, according to the available data) and Abstracts Views on Vision4Press platform.
Data correspond to usage on the plateform after 2015. The current usage metrics is available 48-96 hours after online publication and is updated daily on week days.
Initial download of the metrics may take a while.