| Issue |
A&A
Volume 641, September 2020
|
|
|---|---|---|
| Article Number | A110 | |
| Number of page(s) | 12 | |
| Section | Stellar atmospheres | |
| DOI | https://doi.org/10.1051/0004-6361/202038291 | |
| Published online | 16 September 2020 | |
Chromospheric activity of nearby Sun-like stars
R′HK index signature of a recent burst of star formation★
European Space Agency,
ESTEC - Postbus 299,
2200
AG Noordwijk,
The Netherlands
e-mail: This email address is being protected from spambots. You need JavaScript enabled to view it.
Received:
29
April
2020
Accepted:
16
June
2020
Abstract
Context. The chromospheric emission in the cores of the Ca II H & K lines of late-type dwarfs is a well known indicator of magnetic activity that decreases with increasing stellar age.
Aims. I use this indicator to investigate the formation history of nearby G- and early K-type stars with origins at galactocentric distances similar to that of the region where the Sun was born.
Methods. A parent sample of single main-sequence stars with near-solar metallicity and known magnetic activity levels is built from catalogues of stellar atmospheric parameters and chromospheric activity indices. A kinematical approach uses Gaia astrometric data to differentiate thin disc stars from thick disc stars. Measured distributions of R′HK chromospheric activity indices are compared with Monte Carlo simulations based on an empirical model of chromospheric activity evolution.
Results. The thin disc includes a significant fraction of Sun-like stars with intermediate activity levels (2 × 10⁻⁵ ≤ R′HK ≤ 6 × 10⁻⁵), while most early K- and G-type stars from the thick disc are inactive (R′HK < 2 × 10⁻⁵). The chromospheric activity distribution among nearby Sun-like dwarfs from the thin disc can be explained by a combination of an old (>6–7 Gyr) star formation event (or events) and a more recent (<3 Gyr) burst of star formation. Such an event is not required to account for the R′HK index distributions of nearby thick disc stars.
Conclusions. The distribution of magnetic activity among local G- and early K-type stars with a near-solar metallicity bears the imprint of an important star formation event that occurred ~1.9–2.6 Gyr ago in the thin disc of the Milky Way.
Key words: Galaxy: evolution / solar neighborhood / stars: general / stars: activity / stars: chromospheres / stars: late-type
Table B.1 is only available at the CDS via anonymous ftp to cdsarc.u-strasbg.fr (130.79.128.5) or via http://cdsarc.u-strasbg.fr/viz-bin/cat/J/A+A/641/A110
© ESO 2020
1 Introduction
Although galaxies with stellar masses similar to those of the Milky Way and Andromeda constitute the majority of the bright galaxy population in the local Universe, our knowledge of their formation is still largely incomplete (e.g. Rix & Bovy 2013, Papovich et al. 2015). Understanding their star formation history is thus an important topic in astronomy. Regarding the Milky Way, many studies of the star formation rate as a function of age are based on measurements of the stellar metallicity distribution combined with Galactic chemical evolution models (e.g. Snaith et al. 2015; Haywood et al. 2018; Toyouchi & Chiba 2018).
Alternatively, it has long been known that the emission reversal in the cores of the Ca II H & K Fraunhofer lines of late-type dwarfs is correlated with their age and is potentially an accurate age indicator (e.g. Wielen 1974). Because of various uncertainties in observational data, Mayor & Martinet (1977) could not significantly constrain the time variation of the stellar birth rate in the solar neighbourhood from the kinematics and calcium emission intensity of nearby K dwarfs. Several studies have intended to calibrate this emission as a function of age (e.g. Soderblom et al. 1991; Lachaume et al. 1999; Mamajek & Hillenbrand 2008; Lorenzo-Oliveira et al. 2018; Booth et al. 2020; Zhang et al. 2019).
The emission in the cores of the Ca II H & K lines is a well-known sign of departure from radiative equilibrium that requires additional mechanisms that are generally termed activity (Hall 2008). A major contributor to stellar activity is the evolution and variability of magnetic fields via heating by Alfvén waves or transport of mechanical energy along magnetic flux tubes into the outer atmosphere of cool stars.
Using the Ca II H & K signature, the Mount Wilson programme measured the chromospheric activity of more than a thousand nearby stars over a time span of more than four decades (Wilson 1968; Duncan et al. 1991; Baliunas et al. 1995). In a sample of 486 FGKM stars from the Northern Hemisphere within 25 pc of the Sun, Vaughan & Preston (1980) noted an apparent deficiency in the number of F- and G-type stars exhibiting an intermediate activity level between that of the Hyades and that of the Sun.
One decade later, Henry et al. (1996) confirmed the existence of a bimodal distribution in a sample of 800 southern stars within 50 pc of the Sun that included mainly G dwarfs, with active and inactive groups separated by the so-called Vaughan-Preston gap at  −4.75. However, the authors noted that this gap is more a transition zone as there is not a complete absence of stars at any intermediate activity level.
More recently, Hinkel et al. (2017) indicate that the Vaughan-Preston gap is well populated, with a broad continuous distribution extending across the  activity range from −4.8 to −4.3 in a sample of 951 nearby FGK main-sequence stars. Investigating the chromospheric activity distribution among 4454 cool stars taken from several surveys, Boro-Saikia et al. (2018) similarly report some indication of a bimodal distribution of activity with a considerable fraction of stars in the region corresponding to the Vaughan-Preston gap.
Different explanations have been proposed for these observed distributions. Some authors suggested that the Vaughan-Preston gap is an indication of two distinct physical phenomena, such as different stellar populations (Baliunas et al. 1995; Henry et al. 1996), different stellar dynamo modes or magnetic fields topologies (Durney et al. 1981; Middelkoop 1982; Böhm-Vitense 2007), or rapid shifts in differential rotation (Metcalfe et al. 2016). According to other studies, the gap is the result of a temporal effect caused by a smooth (Noyes et al. 1984), rapid (Pace et al. 2009), or critical spin-down rate of the rotation (Vaughan & Preston 1980; Middelkoop 1982; Noyes et al. 1984).
Although no definitive explanation has been found, Barry (1988) concluded: “the most likely explanation for the gap is that the Milky Way has experienced several rises and declines in the star formation rate over its history and has recently experienced another sharp rise”. It was, however, then argued (e.g. Soderblom et al. 1991) that attempts to use chromospheric data to estimate accurate ages of solar-type stars were premature, and that the physically simplest relationship that was compatible with the observations was a star formation rate that had not varied significantly over the past 9 Gyr.
Since then, the situation has significantly evolved. The solar neighbourhood is now known to include different stellar populations that have built up over the history of the Milky Way (Hayden et al. 2020) and that originated in different parts of the Galaxy. Various studies indicate that the star formation history in the Milky Way does not follow a simple constant or decreasing shape with time up to the present (e.g. Bernard 2017; Mor et al. 2019; Fantin et al. 2019).
Progress has also been made in characterising the time evolution of magnetic activity on Sun-like stars. As young Sun-like stars arrive on the main sequence, magnetic heating processes in their chromospheres and coronae induce ultraviolet and X-ray emission about ten and 1000 times the levels observed in the present-day Sun, respectively (Güdel 2007; Gondoin et al. 2012). The slowest rotating stars then experience a rapid transition of their magnetic activity to more moderate levels around  4 × 10⁻⁵ and LX ≈ 1029 erg s−1 ; this transition occurs later on more rapidly rotating stars, up to an age of ~600 Myr for the fastest rotators (Gondoin 2012, 2013, 2018). After this brief episode of large magnetic activity decay, the average chromospheric emission levels of solar-mass stars decrease steadily (Lorenzo-Oliveira et al. 2016, 2018; Booth et al. 2020), reaching
  10−5 by the time the stars reach the age of the Sun.
The present study examines the distribution of magnetic activity among nearby Sun-like stars in light of these recent studies. Section 2 describes a parent sample of single main-sequence stars with near-solar metallicity and known magnetic activity levels extracted from catalogues of stellar atmospheric parameters and chromospheric activity indices. A kinematical approach uses Gaia astrometric data (Gaia Collaboration 2018) to differentiate stars from the thin and thick discs of the Galaxy. Section 3 derives an evolutionmodel of the chromospheric activity of Sun-like stars beyond the age of 1 Gyr from recent measurements of stellar rotation periods in intermediate-age open clusters. Section 4 uses this empirical model to simulate measured distribution of chromospheric activity indices in various populations of nearby Sun-like stars. The analysis results are discussed in Sect. 5.
2 Sample selection
2.1 Parent sample of nearby Sun-like stars
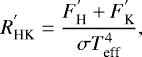
The magnetic activity level of cool stars has traditionally been quantified by the  index, defined as the ratio of the emission in the core of the Ca II H & K lines to the total bolometric emission of the star (Noyes et al. 1984). This index can be expressed as follows (e.g. Linsky 1979; Martinez-Arnaiz et al. 2010):
 (1)
(1)
where  and
and  are the emission fluxes in the cores of the Ca II H & K lines and σ is the Stefan-Boltzmann constant.
Boro-Saikia et al. (2018) compiled a chromospheric activity catalogue of 4454 cool stars from a combination of archival spectra and multiple surveys. These include: the Ar2011 Magellan survey (Arriagada 2011); the Wr2004 and Is2010 California and Carnegie planet search (Wright et al. 2004); the He1996 and Gr2006 surveys of southern solar-type stars carried out by Henry et al. (1996) and Gray et al. (2006); the Ha2009 stellar activity program of the Lowell observatory (Hall et al. 2009); the Lo2011 and Bo2013 high-resolution archival spectra (Lovis et al. 2011; Bonfils et al. 2013); and data from the Mount Wilson survey (Duncan et al. 1991; Baliunas et al. 1995) recently released by the National Solar Observatory. The  indices used in this study are those that were converted by Boro-Saikia et al. (2018) from S-index measurements taken from existing values in the literature and which had already been calibrated to the Mount Wilson scale (Vaughan & Preston 1980; Duncan et al. 1991).
I correlated this  index catalogue with the PASTEL catalogue (Soubiran et al. 2016), which is a continuation of an effort to make high-quality iron abundances available to a wide community (Soubiran et al. 2010; Cayrel de Strobel et al. 2001). This bibliographical catalogue compiles stellar atmospheric parameters, including effective temperature, surface gravity, and iron abundance determinations obtained from detailed analyses of high-resolution, high signal-to-noise spectra, carried out with the help of model atmospheres.
Within the cross-correlated list, I selected stars that have [Fe/H] measurements with median absolute deviations and that are classified as luminosity class V stars with the spectral type specification of a single star. Stars reported as binary stars (e.g. with two spectral types), stars with no spectral type or luminosity class specification, and stars with incomplete spectral type (e.g. without subclass specification) were systematically discarded. The selected stars were cross-matched with the Gaia DR2 catalogue (Gaia Collaboration 2018). I compiled a sample of nearby Sun-like stars that includes stars with parallaxes greater than 20 mas and with known proper motions and radial velocities. Their stellar properties are provided in Table B.1). The histograms of their parallaxes, B−V colour indices, metallicities, and chromospheric activity indices are shown in Fig. 1.
Following the approach of Henry et al. (1996), I classified the chromospheric activity levels into low ( ), intermediate (
 ), and high (
 ). Most sample stars (72%) have a low chromospheric activity level, a small fraction (27%) have an intermediate activity level, and very few (~1%) have a high activity level. The
  versus B − V diagram of the 691 sample stars is shown in Fig. 2. The apparent deficit in the number of F- and G-type stars (0.4 ≤ B−V ≤ 0.7) with intermediate activity levels (2
 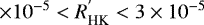 ) is reminiscent of the Vaughan-Preston gap (Vaughan & Preston 1980).
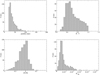 |
Fig. 1 Histograms of the parallaxes (top left), B−V colour indices (top right), metallicities (bottom left), and |

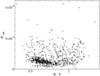 |
Fig. 2
|

2.2 Subsamples of nearby Sun-like stars
Gray et al. (2003) found that the distribution of chromospheric activity indices for dwarfs and giants with 0.5 < B−V < 0.90 located within 40 pc of the Sun is bimodal. They interpreted this result as a manifestation of the Vaughan-Preston gap. However, they observed that this bimodality is a strong function of metallicity. The distribution is strongly bimodal for stars with [Fe/H] > −0.2 but single-peaked for stars of lower metallicity. The authors speculated that this result is perhaps not too surprising, as metal-weak stars were expected to be, on average, older than metal-rich stars, and thus less active.
It is now well established that there is no relationship between age and metallicity among stars in the solar neighbourhood (e.g., Casagrande et al. 2011; Haywood et al. 2013; Bergemann et al. 2014; Kordopatis et al. 2015; Buder et al. 2018; Hayden et al. 2018) or between the age and metal content of open clusters (Friel et al. 2010; Yong et al. 2012; Netopil et al. 2016). Little if any variation of mean metallicity with age has been found, except for the very oldest stars (>10 Gyr).
The lack of an overall age-metallicity relationship instead indicates that nearby stars come from a variety of birth radii in the Milky Way. For example, stars with [Fe/H] > 0.2 dex are too metal-rich to have formed in the solar neighbourhood, as the local ISM metallicity today is slightly subsolar (Nieva & Przybilla 2012). The likely origin of these stars is the inner Galaxy, as there are strong radial metallicity gradients in the disc where the median metallicity of stars in the inner Galaxy is much higher than in the solar neighbourhood (e.g. Luck & Lambert 2011; Lemasle et al. 2013; Anders et al. 2014; Hayden et al. 2014).
In order to distinguish local dwarfs from stars formed in the inner or in the outer disc of the Galaxy, this study focusses on nearby stars with near-solar metallicities, that is to say −0.2 ≤ [Fe/H] ≤ +0.2. This range encompasses the metallicities of open clusters at galactocentric distances comparable to that of the Sun (e.g. Netopil et al. 2016, Cunha et al. 2016, Donor et al. 2018). Open clusters in the outer disc of the Milky Way have lower metallicities (e.g. Cantat-Gaudin et al. 2016).
Gilmore & Reid (1983) discovered a dichotomy in the density distribution of nearby stars in the direction perpendicular to the Galactic plane. They found that this distribution is well described by two separate exponential profiles with different scale heights. Stars from the thick disc move in Galactic orbits with a scale height of 800 (e.g. Reyle & Robin 2001)–1300 pc (e.g. Chen 1997), whereas thin disc stars have a scale height of 100–300 pc (e.g. Robin et al. 1996). The thick disc as a whole is a more slowly rotating stellar system than the thin disc, lagging behind the local standard of rest (LSR) by approximately 50 km s−1.
I used a kinematical approach (see Appendix A) to divide the sample of nearby Sun-like stars with solar-like metallicity into two subsamples of thin disc and thick disc stars. Their  indices are plotted as a function of their W velocity component of space motion normal to the galactic plane in Fig. 3. Thin disc stars (PR ≤ 1) are marked by empty circles and thick disc stars by filled circles (PR > 1), where PR is the calculated thick disc over thin disc membership probability ratio.
The separation between thin disc and thick disc stars is well defined in the  versus W plot. Most thick disc stars have a velocity component perpendicular to the Galactic plane higher than 15 km s−1, while most thin disc stars are confined to the ±15 km s−1 velocity range. Within the subsample of 447 nearby stars with near-solar metallicity (−0.2 ≤ [Fe/H] ≤ 0.2), 335 stars were classified as thin disc stars and 112 as thick disc stars. No halo stars were found in this metallicity range.
Figure 4 shows the  index histograms of these two subsamples. Very few nearby stars with metallicities comparable to that of the Sun have a high level of magnetic activity. The few stars with
  6.10−5 belong to the thin disc subsample that contains a significant number of stars with intermediate activity levels (2.10
 6.10−5). In the thick disc subsample, most stars have a low activity level (
 2.10−5), few have an intermediate activity level, and none have a high activity level. A two-sample Kolmogorov-Smirnov test contradicts the hypothesis that the
  datasets of thin and thick disc stars with near-solar metallicities come from the same distribution.
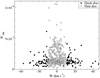 |
Fig. 3
|

3 Chromospheric activity to age relationship
Although some controversy arose on the use of chromospheric emission as a reliable age indicator (Pace & Pasquini 2004; Pace 2013), most recent studies have established the viability of deriving usable chromospheric ages for solar-type stars up to at least 6 Gyr, providing that mass and metallicity effects are accounted for (Lorenzo-Oliveira et al. 2016). Using high resolution spectroscopic observations of a large sample of solar twins, Lorenzo-Oliveira et al. (2018) derived a relationship 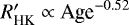 valid for solar twins with ages between 0.6 and 9 Gyr, which they interpreted as an approximation of the more complex activity evolution relationship formulated by Mamajek & Hillenbrand (2008). Some scatter was attributed to stellar cycle modulation effects. Using a sample of solar-type stars with asteroseismic ages, Booth et al. (2020) also find a reasonable agreement with the Mamajek & Hillenbrand (2008) relationship, with some scatter due to stellar mass.
In order to avoid the uncertainty associated with the age determination of field stars, I characterised the long-term evolution of chromospheric activity on Sun-like stars indirectly, following the approach used in Gondoin (2018). The approach consists of combining a best fit parametric model of the rotation evolution of Sun-like stars in open clusters with rotation-activity relationships. It uses the biunique relationship between the chromospheric activity index  of main-sequence stars and their Rossby number that was derived by Mamajek & Hillenbrand (2008), that is to say:
![Mathematical equation: \begin{eqnarray*}\log R_{\textrm{HK}}^{'}= \left\{ \begin{array}{rl} -4.35-1.451(\mbox{Ro}-0.32) &\quad\mbox{if Ro $<$ 0.32} \\[3pt] -4.35-0.337(\mbox{Ro}-0.32) &\quad\mbox{if Ro $\ge$ 0.32} \end{array} \right., \end{eqnarray*}](/articles/aa/full_html/2020/09/aa38291-20/aa38291-20-eq30.png) (2)
(2)
where the Rossby number Ro is defined as the ratio of the star’s rotation period P over its convective turnover time τconv. Here P is time and mass dependent while τconv mainly depends on stellar mass for main-sequence stars (e.g. Landin et al. 2010), hence:
 (3)
(3)
Equation (2) uses the Rossby number values derived from the convective turnover time relation as a function of B−V colour that was established empirically by Noyes et al. (1984). This determination has often been used in the literature, although it was initially based on only a few points redder than B− V = 1.0. Pizzolato et al. (2003) provided improved values using a sample with a greater coverage of low-mass stars. Based on these consolidated values, Wright et al. (2011) suggest that stellar mass is the relevant physical parameter that determines the convective turnover time and derived the following relationship:
 (4)
(4)
where M is the mass in solar unit. This relationship is valid over the range 0.09 < M < 1.36. It is in good agreement (see Fig. 7 in Wright et al. 2011) with that of Noyes et al. (1984).
The mean rotation rates of main-sequence stars at intermediate ages were derived from measured rotation periods versus B− V indices or effective temperatures in NGC 6811 (see Fig. 4 in Meibom et al. 2011 and Fig. 5 in Curtis et al. 2019), in NGC 6819 (see Fig. 3 in Meibom et al. 2015), and in M67 (see Fig. 4 in Barnes et al. 2016). These open clusters are 1.0 Gyr (Sandquist et al. 2016), 2.4 Gyr (Brewer et al. 2016), and 4 Gyr (VandenBerg et al. 2004) old, respectively, and have solar metallicities (Corsaro et al. 2017, Liu et al. 2019). The B − V indices (and effective temperatures in Curtis et al. 2019) were converted to masses using the table in Mamajek (2018) that provides mean stellar parameters, including B−V indices, masses, and effective temperatures based on a survey of the literature and catalogue values. For 0.58 ≤ B−V ≤ 1.15, the colour index to mass conversion was approximated by:
 (5)
(5)
The mean rotation periods versus masses and ages inferred from measurements in NGC 6811, NGC 6819, and M 67 are summarised in Table 1. Based on this information, I derived a formulation of the rotation periods of 0.7–1.1 M⊙ main-sequence stars with near-solar metallicity as a function of their mass and age that is valid between the ages of 1 and 4 Gyr, that is to say:
 (6a)
(6a)
where t0 = 1 Gyr and:
 (6b)
(6b)
 (6c)
(6c)
P is the rotation period of the star in days, M is its mass in solar unit, and t is its age in Gyr. The mass-exponent relation is a uniformly decreasing function of mass. The maximum absolute deviation between the measured and predicted slope n(M) in the 0.7–1.1 M⊙ range is 0.036.
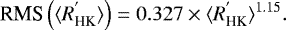
Figure 5 shows the interpolated evolution of the rotation periods of 0.7, 0.8, 0.9, 1.0, and 1.1 M⊙ stars between the ages of 1 and 4 Gyr. This evolution depends on stellar mass with a steeper decay for low-mass stars.
I used the empirical formulation of the convective turnover time by Wright et al. (2011) and derived the long-term evolution of the  index of main-sequence stars with masses between 0.7 M⊙ and 1.1 M⊙ by combining Eqs. (2)–(4), and (6a)–(6c).
In the absence of rotation period measurements in open clusters older than 4 Gyr, this empirical derivation of  becomes uncertain beyond the age of the Sun. However, beyond this age, observations of field stars show that the emission flux in the cores of the Ca II H & K lines reaches a lower limit, the so-called basal chromospheric flux (Schrijver 1987). The basal chromospheric flux appears not to be photospheric in nature but rather reflects a residual chromospheric heating. It could either result from the dissipation of mechanical, not magnetic, wave energy such as acoustic waves (e.g. Perez Martinez et al. 2011 and references therein) or from the action of a minimal magnetic activity.
This empirical limit distinctly depends on effective temperature (Rutten et al. 1991). Using the empirical formula of Perez Martinez et al. (2014) for the basal Ca II flux as a function of the star effective temperature Teff, the corresponding basal chromospheric activity index  can be expressed as follows:
 (7)
(7)
To limit the uncertainty of the chromospheric activity level of stars older than 4 Gyr, I calculated the  index evolution of 0.7–1.1 M⊙ stars using Eq. (2) until it reaches the mass dependent basal chromospheric index
  . I then assumed that
  remains constant to this value.
According to this model, a solar-mass star would reach the basal chromospheric activity level at an age of ~6.6 Gyr, in agreement with the view that: “if a magnetic weakened breaking scenario takes place at all, it should arise after ages ≳5.3 Gyr” (Lorenzo-Oliveira et al. 2019). Recent data from Booth et al. (2020) indicate that magnetic activity continues to decrease even at old stellar ages for both G-type stars and the coolest F-type stars that have a convective envelope. Assuming a continuously decreasing chromospheric activity without any basal chromospheric limit has a negligible effect on the results of the study.
While stellar rotation evolves slowly with time, magnetic activity varies on much shorter timescales. The physical mechanisms producing such variability include changes in the filling factor of active regions, growth and decay of individual emitting regions, and activity cycles. I used the results from Radick et al. (1998) to estimate the dispersion of the  indices due to the short-term variability of magnetic activity around the average
  values derived from the long-term evolution of stellar rotation. The authors found that chromospheric variations for their entire sample of F5- to K7-type stars that spanned a range of chromospheric activity indices between −5.05 and −4.15 were fairly well related by power laws to average chromospheric activity levels. An estimate of the cyclic chromospheric RMS variation (see Fig. 5 in Radick et al. 1998) is given by:
 (8)
(8)
The right-hand graph in Fig. 5 shows the derived evolutions of the  index for 0.7, 0.8, 0.9, 1.0, and1.1 M⊙ dwarfs, excluding the short-term variability of their magnetic activity. The curves are remarkably similar, indicating that the chromospheric activity to age relationship depends moderately on mass in the 0.7–1.1 M⊙ range. The
  indices of 0.7–0.8 M⊙ stars decay slightly faster than those of 1.0–1.1 M⊙ stars. Solar-mass stars reach their basal chromospheric level around the age of 7 Gyr, while lower-mass stars reach their lowest activity level later, beyond the age of 10 Gyr for 0.7 M⊙ stars. In the 0.7–1.1 M⊙ range, the relative dispersion of the
  index resulting from the short-term variability of chromospheric activity is about 6 to 7%, according to Eq. (7). Its relative variation due to mass is ~9% at 1 Gyr and 11% at 4 Gyr (see right-hand graph in Fig. 5).
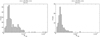 |
Fig. 4 Histograms of the |

Mean rotation periods (in days) vs. mass and age of main-sequence stars with near-solar metallicity derived from measurements in NGC 6811 (Meibom et al. 2011; Curtis et al. 2019), NGC 6819 (Meibom et al. 2015), and M 67 (Barnes et al. 2016).
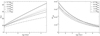 |
Fig. 5 Left: rotation period evolution of 0.7–1.1 M⊙ stars with near-solar metallicity derived from rotation period measurements in NGC 6811 (1 Gyr; Curtis et al. 2019), NGC 6819(2.4 Gyr; Meibom et al. 2015), and M 67 (4.0 Gyr; Barnes et al. 2016). Right: average Ca II
|

4 Simulated versus measured R index distributions
The magnetic activity of Sun-like stars younger than about ~600 Myr depends notonly on their age but also on their initial rotation rate after circumstellar disc dispersion (Gondoin 2018). Beyond ~600 Myr, the rotation rates of Sun-like stars with similar masses converge towards similar values (e.g. Gondoin 2017 and reference therein) and stellar age becomes the main parameter that determines the chromospheric activity level of 0.7–1.1 M⊙ stars with near-solar metallicity (see Fig. 5, right). Beyond the age of ~6 or 7 Gyr, the chromospheric activity of old Sun-like stars gets close to its basal chromospheric activity level and barely decays with age. The distribution of  indices in a population of Sun-like stars with near-solar metallicity can thus be used to constrain its age distribution between about 600 Myr and 6 Gyr.
Various studies indicate that the star formation history of the Milky Way disc consists of several episodes of star formation occurring atdifferent epochs (e.g. Vergely et al. 2002; Cignoni et al. 2006; Snaith et al. 2015; Haywood et al. 2016; Mor et al. 2019). Based on this picture, I assumed that the stellar birth function (i.e the number of stars born per unit of mass and time) of a population of nearby stars can be expressed as:
 (9)
(9)
with
![Mathematical equation: \begin{eqnarray*} \mbox{SBF}_{\textrm{i}}(M,t) = \left\{ \begin{array}{ll} 0 &\quad\mbox{if}\ t > t_{\textrm{i}} \\[5pt] N_{\textrm{i}}(M) \times \exp{{t-t_{\textrm{i}} \over \tau_{\textrm{i}}(M)}}&\quad\mbox{if}\ t \le t_{\textrm{i}} \end{array} \right.,\end{eqnarray*}](/articles/aa/full_html/2020/09/aa38291-20/aa38291-20-eq53.png) (10)
(10)
where Ni(M) is the initial number of stars with masses between M and M + dM that formed at ages between ti and ti + dt during a star formation event i that began ti years ago and decayed exponentially with a timescale τi. A decaying exponential function provides the simplest description of a star formation event whose main characteristics are a steep rise and a slow decline (e.g. Diemer et al. 2017).
The agedistribution of a population of main-sequence stars can be expressed as:
 (11)
(11)
where H(t) is the step function that accounts for stellar evolutionary effects. Equation (11) requires that luminosity class V stars with a mass M have an age included between the zero age main sequence τZAMS(M) and the end of main-sequence lifetime τMS(M). The intrinsic  index distribution of a sample of Sun-like stars can be derived from its age distribution G(M, t) using the age-activity relationship derived in Sect. 3.
The measurement of this  index distribution may be affected by measurement errors. Assuming that these errors follow a Gaussian distribution with a standard deviation σHK and a systematic error δHK, the mean value
  and standard deviation RMS
 of the measured
  indices of a star can be expressed as:
![Mathematical equation: \begin{eqnarray*} \left\{ \begin{array}{ll} R_{\textrm{HK}}^{' \rm meas} = R_{\textrm{HK}}^{'} +\delta_{\textrm{HK}} \\[3pt] \mbox{RMS}\left(\langle R_{\textrm{HK}}^{' \rm meas}\rangle\right) = \sqrt{\mbox{RMS} \langle R_{\textrm{HK}}^{'}\rangle^{2} + \sigma^{2}_{\textrm{HK }}}, \\ \end{array} \right.\end{eqnarray*}](/articles/aa/full_html/2020/09/aa38291-20/aa38291-20-eq60.png) (12)
(12)
where  is the average activity index derived from the Rossby number of the star (see Eq. (2) and
  is the RMS variation of its activity index due to the short-term variability of its magnetic activity (see Eq. (8)).
Using the age distribution formulated in Eqs. (9)–(11), I ran Monte Carlo simulations of  index distributions in the thin and thick disc subsamples. The mass of each star was estimated from its B− V colour indexaccording to Eq. (5). Each star of a subsample was assigned a birth date that was randomly generated given the functional form of the stellar birth function in that subsample as described in Eqs. (9) and (10). The masses and ages of all stars in a subsample were used to calculate their rotation periods using Eqs. (6a)–(6c), their Rossby numbers (Eqs. (3) and (4)), and their chromospheric activity indices (Eqs. (2) and (7)), including short-term variability effects (Eq. (8)). Measurement errors were also accounted for using Eq. (12). A thousand distributions were calculated for each set of model parameters. The simulated cumulative histograms (i.e. the number of stars that have a chromospheric activity index greater than the
  variable) were averaged over these 1000 Monte Carlo simulations. I performed an unweighted least-squares fit of the modelled averaged cumulative histogram on the data points of the observed cumulative histogram that were tightly sampled with a resolution
  = 10−7.
The model parameters are the initial number of stars N1 in the first star formation event, its age t1 and decay time τ1, the initial number of stars N2 in the second star formation event, its age t2 and decay time τ2, the standard deviation σHK, and systematic error δHK of the  measurements. Since the chromospheric activity of Sun-like stars older than 6–7 Gyr depends little on age, the measured
  index distributions cannot constrain the age distribution of their parent populations beyond the age of 6–7 Gyr. Based on the Fantin et al. (2019) study, I thus assumed that the onset of star formation occurred 11.3 Gyr ago in the thick disc and 8.5 Gyr ago in the thin disc, that is to say I imposed t1 = 11.3 Gyr and t1 = 8.5 Gyr for the thick disc and thin disc stars, respectively.
According to Eqs. (3), (10), and (11), the number of stars Nstars(M) in a considered subsample is linked to the model parameters of its stellar birth function by the following equation:
 (13)
(13)
put another way,
![Mathematical equation: \begin{equation*} N_{\textrm{stars}} = \sum_{i} N_{\textrm{i}} \bigg[ \exp{{(\min{(t_{\textrm{i}}, \tau_{\textrm{MS}})} - t_{\textrm{i}}) \over \tau_{\textrm{i}}}} - \exp{{(\tau_{\textrm{ZAMS}} - t_{\textrm{i}}) \over \tau_{\textrm{i}}}} \bigg]. \nonumber \end{equation*}](/articles/aa/full_html/2020/09/aa38291-20/aa38291-20-eq69.png)
Figure 6 shows the measured cumulative histograms of the  indices of nearby stars in the thick and thin discs. The grey areas represent the ±1σ rms envelopes of 1000 simulations of the
  index cumulative distributions around the best fit models. A good fit to the measured
  cumulative histograms of nearby stars from the thick disc is obtained using a model with only one initial star formation event that occurred 11.5 Gyr ago (see left-hand graph in Fig. 6). A model with a second episode of star formation is needed to reproduce the measured cumulative histograms of the
  indices of nearby stars from the thin disc (see right-hand graph in Fig. 6). The improvement in χ2 fit statistics when adding a second episode of star formation to the model is significant at >99.9% confidence levels for thin disc stars. The measured cumulated histograms lie within the ±1σ rms envelopes of the best fit models almost everywhere. Some differences between the models and the measurements appear at very low chromospheric activity levels (
 7–8×10⁻⁶).
The parameters of the models that best fit the measured  index distribution of each group are listed in Table 2. The inferred age distributions of parent populations of nearby stars in the thick and thin discs are plotted in Fig. 7. According to Table 2, the best estimate for the start of a second burst of star formation in the thin disc is t2 = 2.3 Gyr. The degradation in fit statistics when assigning t2 to a value outside the 1.9–2.6 Gyr interval is significant at a >99.9% confidence level, excluding any impact of the sample incompleteness. Applying the fitting procedure to a nearby subsample of 166 thin disc stars with parallaxes greater than 30 mas leads to a slightly more constrained interval of 2.0–2.6 Gyr for t2. Applying the fitting procedure to a remote subsample of 106 thin disc stars with parallaxes between 20 and 30 mas leads to a less constrained interval of 1.3–2.6 Gyr; this could be attributed, at least partly, to a lower number of sample stars and to larger measurement errors on the
  indices due to the larger distances of the stars.
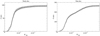 |
Fig. 6 Measured cumulative histograms of the |


Stellar birth function parameters that best fit the measured  distributions of nearby early K- and G-type stars with −0.2 ≤ [Fe/H] ≤ 0.2 and parallaxes greater than 20 mas from the thick disc and the thin disc of the Milky Way.
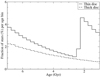 |
Fig. 7 Age distributions inferred from |

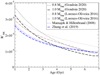 |
Fig. 8 Average Ca II |

5 Discussion
Following the approach in Gondoin (2018), I derived a model of the  index evolution of 0.7–1.1 M⊙ stars by combining a rotation-activity relationship with rotation period measurements in the NGC 6811, NGC 6819, and M 67 open clusters that are 1.0, 2.4, and 4.0 Gyr old, respectively. Figure 8 compares this evolution for 0.8 and 1.0 M⊙ dwarfs with the age versus
  relationship from Lorenzo-Oliveira et al. (2018) applied to 0.8 and 1.0 M⊙ stars with a solar metallicity. This relationship was derived from a sample of field stars selected from Adibekyan et al. (2012) and complemented with selected objects from the Pleiades (0.1 Gyr), the Ursa Major (0.3 Gyr) moving group, the Hyades (0.6 Gyr), and M 67 (4.0 Gyr). The
  versus age relationship that I derived from rotation period measurements in clusters is similar to, though steeper than, the relationship from Lorenzo-Oliveira et al. (2018). For 0.8 and 1.0 M⊙ dwarfs, the
  versus age curves of the two studies intercept each other at ages of 2.8 and 2.2 Gyr, respectively.
Figure 8 also compares the evolution of the  activity index that I derived from rotation period measurements in NGC 6811, NGC 6819, and M 67 with the mean
  age relationship from Mamajek & Hillenbrand (2008). The
  decay inferred from rotation period measurements in the intermediate-age clusters is also steeper than the
  decay derived by Mamajek & Hillenbrand (2008) from
  data in young (<0.7 Gyr) open clusters and in M 67 (4 Gyr). Figure 8 also shows the
  to age relationship derived from Zhang et al. (2019, see their Fig. 9a) for stars with 4000 K < Teff < 5000 K, assuming
  , where
  is the emission in the Ca II K line normalised to the photospheric flux. The obtained relationship is similar to the one in Mamajek & Hillenbrand (2008). It is the result of a quadratic fit to the average
  index in 22 open clusters, of which 20 are younger than 1 Gyr.
The origin of the difference between the  versus age relationship derived from rotation period measurements in intermediate-age open clusters and previous studies comes from recent observations that stars experience a reduced braking efficiency and stalled spin-down between the ages of ~670 Myr and ~1 Gyr (Curtis et al. 2019; Spada & Lanzafame 2020). Since activity is closely related to rotation, a decay of the chromospheric activity should only begin when stars approach an age of ~1 Gyr. The decay of the
  index inferred from rotation period measurements in 1.0, 2.4, and 4.0 Gyr old clusters is thus steeper than the activity evolution derived from best fits to measured
  data in young (<0.7 Gyr) open clusters and in M 67 (~4 Gyr).
I used this steeper model of chromospheric activity evolution to retrieve the age distributions of parent populations of nearby Sun-like stars in the thin and thick discs of the Galaxy. The Monte Carlo analysis indicates that the measured  index distributions among 0.7–1.1 M⊙ stars from the thin disc can be explained by a combination of old (>6–7 Gyr) star formation events and a more recent burst of star formation. This event is estimated to have started about 2.3 Gyr ago. Such a recent episode of star formation is not required to account for the observed
  index distributions among 0.7–1.1 M⊙ stars from the thick disc.
These results, including the relative numbers of stars issued from the various formation events in particular, should be interpreted with care since the stellar samples used in the analysis are not volume-limited but are assembled from a variety of sources, including multiple surveys, archives, and compilations. Their  index distributions may not be fully representative of the magnetic activity distribution in the solar neighbourhood but may be altered by selection effects and measurement uncertainties. Measurements of
  index distributions are expected to be less accurate and less complete in samples of stars that are intrinsically fainter or located at larger distances.
To investigate such possible effects, I divided each of the two subsamples of thin and thick disc stars into a group of nearby dwarfs with parallaxes greater than 30 mas and a group of remote dwarfs with parallaxes between 20 mas and 30 mas. Although the remote groups come from a volume that is more than twice as large, they contain a smaller number of dwarfs (157 versus 212). The  index histograms of the nearby and remote groups confirm that a significant fraction of thin disc stars have intermediate activity levels (2 × 10
 6 × 10⁻⁵), while most thick disc stars have a low activity level (
 2 × 10⁻⁵).
Two-sample Kolmogorov-Smirnov tests applied to the nearby and remote groups invalidate the hypothesis that thick disc stars and thin disc stars originate from the same parent population. The best fit models to the cumulative histograms of  indices of nearby and remote stars from the thin disc both include a recent star formation event and agree on an age of ~2.0–2.3 Gyr, albeit with a larger uncertainty for the remote stars. This corroborates the conclusion that the measured
  index distributions of nearby Sun-like stars result from the combination of an old (>6–7 Gyr) star formation event (or events) and a more recent episode of star formation.
This conclusion is consistent with various studies that report a recent episode of star formation in the Milky Way. Using HIPPARCOS data in a sphere of 80 pc around the Sun and assuming a fixed initial mass function (IMF), Vergely et al. (2002) and Cignoni et al. (2006) derived maximum peaks of star formation 1.75–2 Gyr ago and 2–3 Gyr ago, respectively. Snaith et al. (2015) and Haywood et al. (2016, 2018) find the existence of a star formation rate quenching followed by a reactivation using data with metallicities and assuming a fixed IMF. Bernard (2017), in a tentative work using TGAS data, pointed towards the existence of a relative maximum of star formation also occurring 2–3 Gyr ago. These results were recently corroborated by Mor et al. (2019), who found an imprint in Gaia DR2 data of a star formation burst that occurred 2–3 Gyr ago in the Galactic thin disc domain, as concluded in the present study. In view of its large timescale and of the large amount of mass involved, some authors (Cignoni et al. 2006; Mor et al. 2019) propose that this recent event is not intrinsic to the disc but is produced by an external perturbation, possibly by a recent merger with a gas-rich satellite galaxy that could have started several Gyr ago.
The measured  index histogram of the subsample of 0.7–1.1 M⊙ stars from the thin disc (see right-hand graph in Fig. 9) does not exhibit a prominent bimodality. The bimodality is more apparent in the Monte Carlo simulations. It is clearly seen as a change of slope on the measured cumulative histogram of
  indices of the thin disc stars (see right-hand graph of Fig. 6). The location of its two maxima in the simulated histogram and of its transition minima around
  2–2.5 × 10⁻⁵ is reminiscent of the bimodal distribution first noted in a sample of northern solar-type stars by Vaughan & Preston (1980) and confirmed in a southern survey by Henry et al. (1996).
Although good fits to the measured  cumulative histograms are obtained, some differences between the models and the measurements appear at very low chromospheric emission levels (see Fig. 6), where the observed number of G-type stars with
  6–7 × 10⁻⁶ is significantly higher than expected from the model. The one-sigma dispersion around the best fit model accounts for four out of 20 G-type dwarfs with
  . Such a discrepancy between the measured and the best fit
  cumulative histograms does not appear for K-type stars.
One explanation is that the measured  indices of G-type stars suffer from uncertainties at low activity levels that are larger than accounted for by the model. No excess of very inactive stars appears in the K-type star groups; this may be because these groups contain fewer stars with low activity levels. Uncertainties at low activity levels could come from the parent S-index measurements. The
  indices used in this study are those converted by Boro-Saikia et al. (2018) from S-index measurements taken from existing values in the literature that had already been calibrated to the Mount Wilson scale (Vaughan & Preston 1980; Duncan et al. 1991). Boro-Saikia et al. (2018) note that when measuring earlier-type stars, the flux in the two continuum bandpasses around the Ca II H and K emissions increases as the bulk of radiation moves towards shorter wavelengths. This results in a typical G-dwarf having a smaller S index than a typical K-type star. Gray et al. (2006) stressed that the transformation from the Mount Wilson S index to
  is not well defined for B− V < 0.5 and becomes increasingly uncertain for stars with B−V > 1.2. The present study focusses on single dwarfs with colour indices in the range 0.58 ≤ B−V ≤ 1.15. Although measurement and conversion errors are not excluded, other explanations are plausible.
Jenkins et al. (2011, see Fig. 6) note that the  distributions of solar-type stars have inactive peaks at −5.004 and −5.140 for the main-sequence stars and subgiants, respectively. The authors defined a cut-off between main-sequence stars and subgiants using the absolute V magnitude distance from the HIPPARCOS main sequence as a function of B−V colour. They classified stars that have a distance from the main sequence of 1 or greater as subgiants. All sample stars in the present study belong by selection to the luminosity class V. However, three of the G-type stars that have anomalously low activity indices would be classified as subgiants according to the criteria in Jenkins et al. (2011), which would explain their very low
  indices.
Recent studies have reported that the activity levels of some main-sequence stars are anomalously low, sometimes falling below the basal envelope (e.g. Staab et al. 2017). This phenomenon has been attributed to circumstellar absorption due to planetary mass-loss (Haswell et al. 2012; Fossati et al. 2013). Large-scale hydrodynamic escape of the upper atmosphere of irradiated short-period planets has been predicted by models (Lammer et al. 2003; Bisikalo et al. 2013; Matsakos et al. 2015) and directly detected through transmission spectroscopy (e.g. Vidal-Madjar et al. 2003; Lecavelier des Etangs et al. 2010; Bourrier et al. 2013; Kulow et al. 2014; Ehrenreich et al. 2018). Heavy species are pulled along by these outflows of hydrogen (Linsky et al. 2010; Fossati et al. 2010; BenJaffel & Ballester 2013). These outflows could feed diffuse circumstellar gas shrouds that absorb the stellar flux in the cores of strong lines of abundant species, depressing the observed chromospheric emission. This phenomenon is rare, as suggested by the occurrence rate of hot Jupiters (Witenmyer et al. 2020), and may only explain a fraction of the G-type stars with anomalously low  indices.
Henry et al. (1996) also noted an excess of stars found at very low chromospheric emission levels  . They concluded that these very inactive stars could consist of dwarfs that have entered a phase similar to the Sun’s Maunder Minimum phase. Reconstructions of past solar activity have revealed that the Sun spends a significant fraction (about 15–20%) of its time in aperiodically recurring states of so-called Grand Minima, namely epochs of strongly suppressed levels of magnetic activity (Usoskin 2013). If such minima occur on G- and early K-type stars that otherwise have an activity level comparable or smaller than that of the normal Sun, the excess of stars with very low chromospheric emission would be smaller in the sample of early K-type dwarfs, since it contains a smaller fraction of stars with a low activity level.
In addition to these very inactive stars and to the Vaughan-Preston transition at  −4.75 between inactive stars and active stars, Henry et al. (1996) noted an additional transition zone near
  −4.2, defining a third population of very active stars. A few members of this very young population are present in the sample of thin disc stars (see Fig. 4, left). The additional transition zone between active and very active field stars is similar to the bimodal distributions of chromospheric and coronal activity indices among Sun-like stars in open clusters with ages between ~30 and ~600 Myr that were inferred by Gondoin (2018) from their rotation evolution (Gondoin 2017 and references therein).
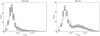 |
Fig. 9 Measured histograms of the |


6 Summary
This study examines the distribution of magnetic activity among local G- and early K-type dwarfs with Galactic birth radii similar to that of the Sun. A parent sample of single main-sequence stars with near-solar metallicity and known magnetic activity levels is built by correlating catalogues of stellar atmospheric parameters and chromospheric activity indices. A kinematical approach uses Gaia astrometric data to differentiate thin disc stars from thick disc stars. The thin disc sample includes a significant fraction of stars with intermediate activity levels (2 × 10 6 × 10⁻⁵), while most early K- and G-type stars of the thick disc are inactive (
 2 × 10⁻⁵).
Following the approach used by Gondoin (2018), I derived a model of the  index evolution of 0.7–1.1 M⊙ stars by combining a rotation-activity relationship with measurements of stellar rotation period in intermediate-age open clusters. This model is used to constrain the age distributions of local G- and early K-type dwarfs from the thin and thick discs of the Galaxy.
The analysis indicates that the measured  index distributions in groups of nearby G- and early K-type stars from the thin disc can be explained by a combination of an old (>6–7 Gyr) star formation event (or events) and a more recent burst of star formation. This event is estimated to have started between 1.9 and 2.6 Gyr ago. Such a recent episode of star formation is not required to account for the observed
  index distributions among nearby Sun-like stars from the thick disc.
This conclusion is consistent with photometric, astrometric, and archaeo-chemistry studies that report a recent burst of a star formation that occurred 2–3 Gyr ago in the Galactic thin disc domain. In view of this large timescale and of the large amount of mass involved, some authors proposed that this recent event is not intrinsic to the disc but is produced by an external perturbation, possibly by a recent merger with a gas-rich satellite galaxy that could have started several Gyr ago.
Although the inferred star formation history explains the chromospheric activity distribution of most local Sun-like stars, a small but higher-than-expected number of G-type stars exhibit very low chromospheric activity indices ( 6–7 × 10⁻⁶), possibly due to measurement errors, evolutionary effects outside of the main sequence, circumstellar absorptions induced by planetary mass losses, or epochs of suppressed levels of magnetic activity similar to the Sun’s Maunder Minimum phase. A few members of the thin disc population show high to very high activity levels (
 6 × 10⁻⁵) similar to those observed in open clusters with ages between ~30 and ~600 Myr, thus providing evidence of the presence of very young stars in the solar neighbourhood.
Acknowledgments
This work has made use of data from the European Space Agency (ESA) mission Gaia (https://www.cosmos.esa.int/gaia), processed by the Gaia Data Processing and Analysis Consortium (DPAC, https://www.cosmos.esa.int/web/gaia/dpac/consortium). Funding for the DPAC has been provided by national institutions, in particular the institutions participating in the Gaia Multilateral Agreement. I am grateful to the anonymous referee for the helpful comments that allowed me to improve the paper.
Appendix A Thick and thin disc stars
The positions and proper motions of non-solar system objects derived from Gaia observations are expressed in the International Celestial Reference System (ICRS). I calculated the Galactic space velocity components of the sample stars in the LSR using the matrix equations given by Johnson & Soderblom (1987), modified to accept stellar positions for equinox 2000.0 in the ICRS as defined in the HIPPARCOS and Tycho catalogues (ESA 1997, Vol. 1, Sect. 1.5.3). According to this, the ICRS coordinates of the north Galactic pole are (αG, δG) = (192.85948°, +27.12825°) and the Galactic longitude of the first intersection of the Galactic plane with the equator is lG = 32.93192°.
The velocity components of the sample stars in the LSR are expressed in a right-handed rectangular coordinate system (x, y, z) in which the velocity components U, V, and W are positive in the direction of the Galactic center, Galactic rotation, and the north Galactic pole, respectively. The space velocity of the sample stars were calculated using the method described in Bensby et al. (2003). Their space velocity components in the LSR are given by:
 (A.1)
(A.1)
where (U, V, W)⊙ = (11.1, 12.2, 7.3) km s−1 is the solar motion with respect to the LSR (Schönrich et al. 2010) and
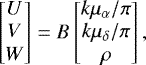 (A.2)
(A.2)
where B = T.A, k = 4.74057 km s−1, μα is the proper motion in right ascension expressed in arcsec yr−1, μδ is the proper motion in declination expressed in arcsec yr−1, ρ is the radial velocity in km s−1, and π is the parallax in arcsec.
The transformation matrix connecting Galactic coordinates and equatorial coordinates is:
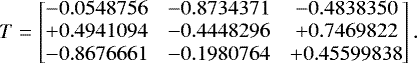 (A.3)
(A.3)
The coordinate matrix A is defined as:
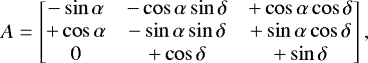 (A.4)
(A.4)
where α is the right ascension and δ is the declination in degrees.
Using the Galactic space velocity components of the sample stars in the LSR, I estimated the likely disc component of origin of each star based on its kinematics following the approach of Reddy et al. (2006), Bensby et al. (2003, 2004), and Mishenina (2004). The selection of the thick or thin disc stars and halo stars are based on the assumption that the Galactic space velocities of these stars have Gaussian distributions. Given these assumptions, the probability that a star belongs to a population i = 1, 2, and 3 for the thin disc, the thick disc, and the halo, respectively, are:
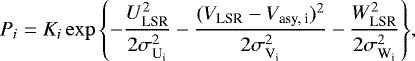 (A.5)
(A.5)
where
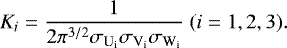 (A.6)
(A.6)
The thick disc over thin disc membership probability ratio is defined as PR = Pthick∕Pthin. Stars with PR ≤ 1 were classified as thin disc stars and stars with PR > 1 as thick disc stars.
Appendix B Stellar sample description
The stellar properties of the parent sample of nearby Sun-like stars used in this study are provided in Table B.1, only available at the CDS. Its content is as follows:
-
Col. 1: star name,
-
Col. 2: spectral type,
-
Cols. 3, 4: right ascension and declination expressed in the International Celestial Reference System (ICRS),
-
Col. 5: parallax in milli-arcsecond,
-
Cols. 6, 7, 8: U, V, W velocity components (km s−1) in the LSR expressed in a right-handed rectangular coordinate system in which the velocity components U, V, and W are positive in the direction of the Galactic center, Galactic rotation, and the north Galactic pole, respectively,
-
Col. 9: B−V colour index,
-
Col. 10: V magnitude,
-
Col. 11:
 chromospheric activity index,
 -
Cols. 12, 13: [Fe/H] and median absolute deviation of [Fe/H] obtained from several determinations available in the PASTEL catalogue (Soubiran et al. 2016),
-
Col. 14: thick disc over thin disc membership probability ratio (see Appendix A).
References
- Adibekyan, V. Zh., Sousa, S. G., Santos, N. C., et al. 2012, A&A, 545, A32 [NASA ADS] [CrossRef] [EDP Sciences] [Google Scholar]
- Anders, F., Chiappini, C., Santiago, B. X., et al. 2014, A&A, 564, A115 [NASA ADS] [CrossRef] [EDP Sciences] [Google Scholar]
- Arriagada, P. 2011, ApJ, 734, 70 [NASA ADS] [CrossRef] [Google Scholar]
- Baliunas, S. L., & Vaughan, A. H. 1985, ARA&A, 23, 379 [NASA ADS] [CrossRef] [Google Scholar]
- Baliunas, S. L., Donahue, R. A., Soon, W. H., et al. 1995, ApJ, 438, 269 [NASA ADS] [CrossRef] [Google Scholar]
- Barnes, S. A., Weingrill, J., Fritzweski, D., et al. 2016, ApJ, 823, 16 [NASA ADS] [CrossRef] [Google Scholar]
- Barry, D.C. 1988, ApJ, 334, 436 [NASA ADS] [CrossRef] [Google Scholar]
- Ben-Jaffel, L., & Ballester, G. E. 2013, A&A, 553, A52 [NASA ADS] [CrossRef] [EDP Sciences] [Google Scholar]
- Bensby, T., Feltzing, S., & Lundström, I. 2003, A&A, 410, 527 [NASA ADS] [CrossRef] [EDP Sciences] [Google Scholar]
- Bensby, T., Feltzing, S., & Lundström, I. 2004, A&A, 421, 969 [NASA ADS] [CrossRef] [EDP Sciences] [Google Scholar]
- Bergemann M., Ruchti, G. R., Serenelli, A., et al. 2014, A&A, 565, A89 [NASA ADS] [CrossRef] [EDP Sciences] [Google Scholar]
- Bernard, E. J. 2017, Proc. Int. Astron. Union, 13, 158 [CrossRef] [Google Scholar]
- Bisikalo, D., Kaygorodov, P., Ionov, D., et al. 2013, ApJ, 764, 19 [NASA ADS] [CrossRef] [Google Scholar]
- Böhm-Vitense, E. 2007, ApJ, 657, 486 [NASA ADS] [CrossRef] [Google Scholar]
- Bonfils, X., Delfosse, X., Udry, S., et al. 2013, A&A, 549, A109 [NASA ADS] [CrossRef] [EDP Sciences] [Google Scholar]
- Booth, R. S., Poppenhaeger, K., Watson, C. A., et al. 2020, MNRAS, 491, 455 [CrossRef] [Google Scholar]
- Bourrier, V., Lecavelier des Etangs, A., Dupuy, H., et al. 2013, A&A, 551, A63 [NASA ADS] [CrossRef] [EDP Sciences] [Google Scholar]
- Boro-Saikia, S., Marvin, C. J., Jeffers, S. V., et al. 2018, A&A, 616, A108 [NASA ADS] [CrossRef] [EDP Sciences] [Google Scholar]
- Brewer, L. N., Sandquist, E. L., Mathieu, R. D., et al. 2016, ApJ, 151, 66 [NASA ADS] [CrossRef] [Google Scholar]
- Buder, S., Asplund, M., Duong, Ly, et al. 2018, MNRAS, 478, 4513 [NASA ADS] [CrossRef] [Google Scholar]
- Cantat-Gaudin, T., Donati, P., Valleneri, A., et al. 2016, A&A, 588, A120 [NASA ADS] [CrossRef] [EDP Sciences] [Google Scholar]
- Casagrande, L., Schönrich, R., Asplund, et al. 2011, A&A, 530, A138 [NASA ADS] [CrossRef] [EDP Sciences] [Google Scholar]
- Cayrel de Strobel, G., Soubiran, C., & Ralite, N. 2001, A&A, 373, 159 [NASA ADS] [CrossRef] [EDP Sciences] [Google Scholar]
- Chen, B. 1997, ApJ, 491, 181 [NASA ADS] [CrossRef] [Google Scholar]
- Cignoni, M., Degl’Innocenti, S., Prada, Moroni, P. G., & Shore, S. N. 2006, A&A, 459, 783 [Google Scholar]
- Corsaro, E., Mathur, S., Garcia, R. A., et al. 2017, A&A, 605, A3 [NASA ADS] [CrossRef] [EDP Sciences] [Google Scholar]
- Cunha, K., Frinchaboy, P. M., Souto, D., et al. 2016, AN, 337, 922 [Google Scholar]
- Curtis, J. L., Agueros, M. A., Douglas, S. T., et al. 2019, ApJ, 879, 49 [NASA ADS] [CrossRef] [Google Scholar]
- Diemer, B., Sparre, M., Abramson, L. E., et al. 2017, ApJ, 839, 26 [NASA ADS] [CrossRef] [Google Scholar]
- Donor, J., Frinchaboy, P. M., Cunha, K., et al. 2018, ApJ, 156, 142 [Google Scholar]
- Duncan, D. K., Vaughan, A. H., Wilson, O. C., et al. 1991, ApJS, 76, 383 [NASA ADS] [CrossRef] [Google Scholar]
- Durney, B. R., Mihalas, D., & Robinson, R. D. 1981, PASP, 93, 537 [NASA ADS] [CrossRef] [Google Scholar]
- Ehrenreich, D. 2018, Nature, 2, 703 [Google Scholar]
- ESA 1997, The Hipparcos and Tycho catalogues, ESA SP-1200 [Google Scholar]
- Fantin, N. J., Cote, P., McConnachie, A. W., et al. 2019, ApJ, 887, 148 [CrossRef] [Google Scholar]
- Fossati, L., Haswell, C. A., Froning, C. S., et al. 2010, ApJ, 714, L222 [Google Scholar]
- Fossati, L., Ayres, T. R., Haswell, C. A., et al. 2013, ApJ, 766, L20 [NASA ADS] [CrossRef] [Google Scholar]
- Friel, E. D., Jacobson, H. R., Pilachowski, C. A., et al. 2010, AJ, 139, 1942 [NASA ADS] [CrossRef] [Google Scholar]
- Gaia Collaboration (Brown, A. G. A., et al.) 2018, A&A, 616, A1 [NASA ADS] [CrossRef] [EDP Sciences] [Google Scholar]
- Gondoin, P. 2012, A&A, 546, A117 [NASA ADS] [CrossRef] [EDP Sciences] [Google Scholar]
- Gondoin, P. 2013, A&A, 556, A14 [NASA ADS] [CrossRef] [EDP Sciences] [Google Scholar]
- Gondoin, P. 2017, A&A, 599, A122 [NASA ADS] [CrossRef] [EDP Sciences] [Google Scholar]
- Gondoin, P. 2018, A&A, 616, A154 [CrossRef] [EDP Sciences] [Google Scholar]
- Gondoin, P., Gandolfi, D., Fridlund, M., et al. 2012, A&A, 548, A15 [NASA ADS] [CrossRef] [EDP Sciences] [Google Scholar]
- Gilmore, G., & Reid, N. 1983, MNRAS, 202, 1025 [Google Scholar]
- Gray, R. O., Corbally, C. J., Garrison, R. F., et al. 2003, AJ, 126, 2048 [NASA ADS] [CrossRef] [Google Scholar]
- Gray, R. O., Corbally, C. J., Garrison, R. F., et al. 2006, AJ, 132, 161 [NASA ADS] [CrossRef] [Google Scholar]
- Güdel, M. 2007, Liv. Rev. Sol. Phys., 4, 3 [Google Scholar]
- Hall, J. C. 2008, Liv. Rev. Sol. Phys., 5, 2 [Google Scholar]
- Hall, J. C., Henry, G. W., Lockwood, G. W., et al. 2009, AJ, 138, 312 [NASA ADS] [CrossRef] [Google Scholar]
- Hartmann, L., Soderblom, D. R., Noyes, R. W., et al. 1984, ApJ, 276, 254 [NASA ADS] [CrossRef] [Google Scholar]
- Hayden, M. R., Holtzman, J. A., Bovy, J., et al. 2014, AJ, 147, 116 [NASA ADS] [CrossRef] [MathSciNet] [Google Scholar]
- Hayden, M. R., Recio-Blanco, A., de Laverny, P., et al. 2018, A&A, 609, A79 [NASA ADS] [CrossRef] [EDP Sciences] [Google Scholar]
- Hayden, M. R., Bland-Hawthorn, J., Sharma, S., et al. 2020, MNRAS, 493, 2952 [Google Scholar]
- Haywood, M., Di Matteo, P., Lehnert, M. D., et al. 2013, A&A, 560, A109 [NASA ADS] [CrossRef] [EDP Sciences] [Google Scholar]
- Haywood, M., Lehnert, M. D., Di Matteo, P., et al. 2016, A&A, 589, A66 [NASA ADS] [CrossRef] [EDP Sciences] [PubMed] [Google Scholar]
- Haywood, M., Di Matteo, P., Lehnert, M. D., et al. 2018, A&A, 618, A78 [NASA ADS] [CrossRef] [EDP Sciences] [Google Scholar]
- Haswell, C. A., Fossati, L., & Ayres, T. 2012, ApJ, 760, 79 [NASA ADS] [CrossRef] [Google Scholar]
- Henry, T. J., Soderblom, D. R., Donahue, R. A., et al. 1996, AJ, 111, 439 [NASA ADS] [CrossRef] [Google Scholar]
- Hinkel, N. R., Mamajek, E. E., Turnbull, M. C., et al. 2017, ApJ, 848, 34 [NASA ADS] [CrossRef] [Google Scholar]
- Jenkins, J. S., Murgas, F., Rojo, P., et al. 2011, A&A, 531, A8 [NASA ADS] [CrossRef] [EDP Sciences] [Google Scholar]
- Jahreiss, H. 1974, PhD thesis, Heidelberg University, Germany [Google Scholar]
- Johnson, D. R. H., Soderblom, D. R. 1987, AJ, 93, 864 [NASA ADS] [CrossRef] [Google Scholar]
- Kordopatis, G., Binney, J., Gilmore, G., et al. 2015, MNRAS, 447, 3526 [Google Scholar]
- Kulow, J. R., France, K., Linsky, J., et al. 2014, ApJ, 786, 132 [NASA ADS] [CrossRef] [Google Scholar]
- Lachaume, R., Dominik, C., Lanz, T., et al. 1999, A&A, 348, 897 [Google Scholar]
- Lammer, H., Selsis, F., Ribas, et al. 2003, ApJ, 598, L121 [NASA ADS] [CrossRef] [Google Scholar]
- Landin, N. R., Mendes, L. T. S., & Vaz, L. P. R. 2010, A&A, 510, A46 [NASA ADS] [CrossRef] [EDP Sciences] [Google Scholar]
- Lecavelier des Etangs, A., Ehrenreich, D., Vidal-Madjar, A, et al. 2010, A&A, 514, A72 [NASA ADS] [CrossRef] [EDP Sciences] [Google Scholar]
- Lemasle, B., Francois, P., Genovali, K., et al. 2013, A&A, 558, A31 [NASA ADS] [CrossRef] [EDP Sciences] [Google Scholar]
- Linsky, J. L., Worden, S. P., McClintock, W., et al. 1979, ApJS, 41, 47 [NASA ADS] [CrossRef] [Google Scholar]
- Linsky, J. L., Yang, H., France, K., et al. 2010, ApJ, 717, 1291 [Google Scholar]
- Liu, F., Asplund, M., Yong, D., et al. 2019, A&A, 627, A117 [NASA ADS] [CrossRef] [EDP Sciences] [Google Scholar]
- Lorenzo-Oliveira, D., Porto de Mello, G. F., & Schiavon, R. P. 2016, A&A, 594, L3 [NASA ADS] [CrossRef] [EDP Sciences] [Google Scholar]
- Lorenzo-Oliveira, D., Freitas, F. C., Melendez, J., et al. 2018, A&A, 619, A73 [CrossRef] [EDP Sciences] [Google Scholar]
- Lorenzo-Oliveira, D., Meléndez, J., Galarza, J. Y., et al. 2019, MNRAS, 485, 68 [Google Scholar]
- Lovis, C., Dumusque, X., Santos, N. C., et al. 2011, ArXiv e-prints [arXiv:1107.5325] [Google Scholar]
- Luck, R. E., & Lambert, D. L. 2011, AJ, 142, 136 [Google Scholar]
- Mamajek, E. E. 2018, A Modern Mean Dwarf Stellar Color and Effective Temperature Sequence, Version 2018.12.10, (http://www.pas.rochester.edu/~emamajek/EEM_dwarf_UBVIJHK_colors_Teff.txt) [Google Scholar]
- Mamajek, E. E., & Hillenbrand, L. A. 2008, ApJ, 687, 1264 [NASA ADS] [CrossRef] [Google Scholar]
- Martinez-Arnaiz, R., Maldonado, J., Montes, D., Eiroa, C., & Montesinos, B. 2010, A&A, 520, A79 [NASA ADS] [CrossRef] [EDP Sciences] [Google Scholar]
- Matsakos, T., Uribe, A., & Königl, A. 2015, A&A, 578, A6 [NASA ADS] [CrossRef] [EDP Sciences] [Google Scholar]
- Mayor, M., & Martinet, L. 1977, A&A, 55, 221 [Google Scholar]
- Meibom, S., Barnes, S. A., Latham, D. W., et al. 2011, ApJ, 733, L9 [NASA ADS] [CrossRef] [Google Scholar]
- Meibom, S., Barnes, S.A.., Platais, I. et al. 2015, Nature, 517, 589 [NASA ADS] [CrossRef] [PubMed] [Google Scholar]
- Metcalfe, T. S., Egeland, R., & van Saders, J. 2016, ApJ, 826, L2 [Google Scholar]
- Middelkoop, F. 1982, A&A, 107, 31 [NASA ADS] [Google Scholar]
- Mishenina T. V., Soubiran C., Kovtyukh, V. V., Korotin, S. A. 2004, A&A, 418, 551 [NASA ADS] [CrossRef] [EDP Sciences] [Google Scholar]
- Mor, R., Robin, A. C., Figueras, F., et al. 2019, A&A, 624, L1 [NASA ADS] [CrossRef] [EDP Sciences] [Google Scholar]
- Netopil, M., Paunzen, E., Heiter, U., et al. 2016, A&A, 585, A150 [NASA ADS] [CrossRef] [EDP Sciences] [Google Scholar]
- Nieva, M.-F., & Przybilla, N. 2012, A&A, 539, A143 [NASA ADS] [CrossRef] [EDP Sciences] [Google Scholar]
- Noyes, R. W., Hartmann, L. W., Baliunas, S. L., et al. 1984, ApJ, 279, 763 [NASA ADS] [CrossRef] [Google Scholar]
- Pace, G. 2013, A&A, 551, L8 [NASA ADS] [CrossRef] [EDP Sciences] [Google Scholar]
- Pace, G., & Pasquini, L. 2004, A&A, 426, 1021 [NASA ADS] [CrossRef] [EDP Sciences] [Google Scholar]
- Pace, G., Melendez, J., Pasquini, L., et al. 2009, A&A, 499, L9 [NASA ADS] [CrossRef] [EDP Sciences] [Google Scholar]
- Papovich, C., Labbe, I., Quadri, R., et al. 2015, ApJ, 803, 26 [NASA ADS] [CrossRef] [Google Scholar]
- Perez Martinez, M. I., Schroder, K.-P., & Cuntz, M. 2011, MNRAS, 414, 418 [NASA ADS] [CrossRef] [Google Scholar]
- Perez Martinez, M. I., Schroder, K.-P., & Hauschildt 2014, MNRAS, 445, 270 [NASA ADS] [CrossRef] [Google Scholar]
- Pizzolato, N., Maggio, A., Micela, G., Sciortino, S., & Ventura, P. 2003, A&A, 397, 147 [NASA ADS] [CrossRef] [EDP Sciences] [Google Scholar]
- Radick, R. R., Lockwood, G. W., Skif, B.A., & Baliunas, S. L. 1998, ApJS, 118, 239 [NASA ADS] [CrossRef] [Google Scholar]
- Reddy, B. E., Lambert, D. L., & Prieto, C. A. 2006, MNRAS, 367, 1329 [NASA ADS] [CrossRef] [Google Scholar]
- Reyle, C., & Robin, A. C. 2001, A&A, 373, 886 [NASA ADS] [CrossRef] [EDP Sciences] [Google Scholar]
- Rix, H.-W., & Bovy, J. 2013, A&ARv, 21, 61 [NASA ADS] [CrossRef] [Google Scholar]
- Robin, A. C., Haywood, M., Creze, M., et al. 1996, A&A, 305, 125 [Google Scholar]
- Rutten, R. G. M., Schrijver, C. J., Lemmens, A. F. P., & Zwaan, C. 1991, A&A, 252, 203 [NASA ADS] [Google Scholar]
- Sandquist, E. L., Jessen-Hansen, J., Shetrone, M.D., et al. 2016, ApJ, 831, 11 [NASA ADS] [CrossRef] [Google Scholar]
- Schrijver, C. J. 1987, A&A, 172, 111 [NASA ADS] [Google Scholar]
- Schönrich, R., Binney, J., & Dehnen, W. 2010, MNRAS, 403, 1829 [NASA ADS] [CrossRef] [Google Scholar]
- Skumanich, A. 1965, AJ, 70, 692 [CrossRef] [Google Scholar]
- Snaith, O., Haywood, M., Di Matteo, P., et al. 2015, A&A, 578, A87 [NASA ADS] [CrossRef] [EDP Sciences] [Google Scholar]
- Soderblom, D.R., Duncan, D. K., & Johnson, D. R. H. 1991, ApJ, 375, 722 [NASA ADS] [CrossRef] [Google Scholar]
- Soubiran, C., Bienayme, O., & Siebert, A. 2003, A&A, 398, 141 [NASA ADS] [CrossRef] [EDP Sciences] [Google Scholar]
- Soubiran, C., Le Campion, J.-F., Cayrel de Strobel, G., et al. 2010, A&A, 514, A111 [NASA ADS] [CrossRef] [EDP Sciences] [Google Scholar]
- Soubiran, C., Le Campion, J.-F., Brouillet, N., et al. 2016, A&A, 591, A118 [NASA ADS] [CrossRef] [EDP Sciences] [Google Scholar]
- Spada, F., & Lanzafame, A. C. 2020, A&A, 636, A76 [CrossRef] [EDP Sciences] [Google Scholar]
- Staab, D., Haswell, C. A., Smith, G. D., et al. 2017, MNRAS, 466, 738 [NASA ADS] [CrossRef] [Google Scholar]
- Toyouchi, D., & Chiba, M. 2018, ApJ, 855, 104 [Google Scholar]
- Usoskin, I. G. 2013, Liv. Rev. Sol. Phys., 10, 1 [Google Scholar]
- VandenBerg, D. A., Don, A., & Stetson, P. B. 2004, PASP, 116, 997 [NASA ADS] [CrossRef] [Google Scholar]
- Vaughan, A. H., & Preston, G. W. 1980, PASP, 92, 385 [NASA ADS] [CrossRef] [Google Scholar]
- Vidal-Madjar, A., Lecavelier Des Etangs, A., Desert, J.-M., et al. 2003, Nature, 422, 143 [NASA ADS] [CrossRef] [PubMed] [Google Scholar]
- Vergely, J.-L., Köppen, J., Egret, D., et al. 2002, A&A, 390, 917 [NASA ADS] [CrossRef] [EDP Sciences] [Google Scholar]
- Wielen, R. 1974, in Highlights of Astronomy, ed. G. Gontopoulos (Dordrecht: Reidel), 3, 395 [NASA ADS] [CrossRef] [Google Scholar]
- Wilson, O. C. 1968, ApJ, 153, 221 [NASA ADS] [CrossRef] [Google Scholar]
- Wilson, O. C.,& Woolley, R. 1970, MNRAS, 148, 463 [NASA ADS] [CrossRef] [Google Scholar]
- Wittenmyer, R. A., Wang, S., Horner, J., et al. 2020, MNRAS, 492, 377 [CrossRef] [Google Scholar]
- Wright, J. T., Marcy, G. W., Butler, R. P., et al. 2004, ApJS, 152, 261 [NASA ADS] [CrossRef] [Google Scholar]
- Wright, N. J., Drake, J. J., Mamajek, E. E., & Henry, G. W. 2011, ApJ, 743, 48 [NASA ADS] [CrossRef] [Google Scholar]
- Yong, D., Carney, B. W., & Friel, E. D. 2012, AJ, 144, 95 [NASA ADS] [CrossRef] [Google Scholar]
- Zhang, J., Zhao, Q. H., Oswalt, T. D., et al. 2019, ApJ, 887, 84 [CrossRef] [Google Scholar]
All Tables
Mean rotation periods (in days) vs. mass and age of main-sequence stars with near-solar metallicity derived from measurements in NGC 6811 (Meibom et al. 2011; Curtis et al. 2019), NGC 6819 (Meibom et al. 2015), and M 67 (Barnes et al. 2016).
Stellar birth function parameters that best fit the measured distributions of nearby early K- and G-type stars with −0.2 ≤ [Fe/H] ≤ 0.2 and parallaxes greater than 20 mas from the thick disc and the thin disc of the Milky Way.
All Figures
|
Fig. 1 Histograms of the parallaxes (top left), B−V colour indices (top right), metallicities (bottom left), and |
| In the text | |
|
Fig. 2
|
| In the text | |
|
Fig. 3
|
| In the text | |
|
Fig. 4 Histograms of the |
| In the text | |
|
Fig. 5 Left: rotation period evolution of 0.7–1.1 M⊙ stars with near-solar metallicity derived from rotation period measurements in NGC 6811 (1 Gyr; Curtis et al. 2019), NGC 6819(2.4 Gyr; Meibom et al. 2015), and M 67 (4.0 Gyr; Barnes et al. 2016). Right: average Ca II
|
| In the text | |
|
Fig. 6 Measured cumulative histograms of the |
| In the text | |
|
Fig. 7 Age distributions inferred from |
| In the text | |
|
Fig. 8 Average Ca II |
| In the text | |
|
Fig. 9 Measured histograms of the |
| In the text | |
Current usage metrics show cumulative count of Article Views (full-text article views including HTML views, PDF and ePub downloads, according to the available data) and Abstracts Views on Vision4Press platform.
Data correspond to usage on the plateform after 2015. The current usage metrics is available 48-96 hours after online publication and is updated daily on week days.
Initial download of the metrics may take a while.