Fig. 8.
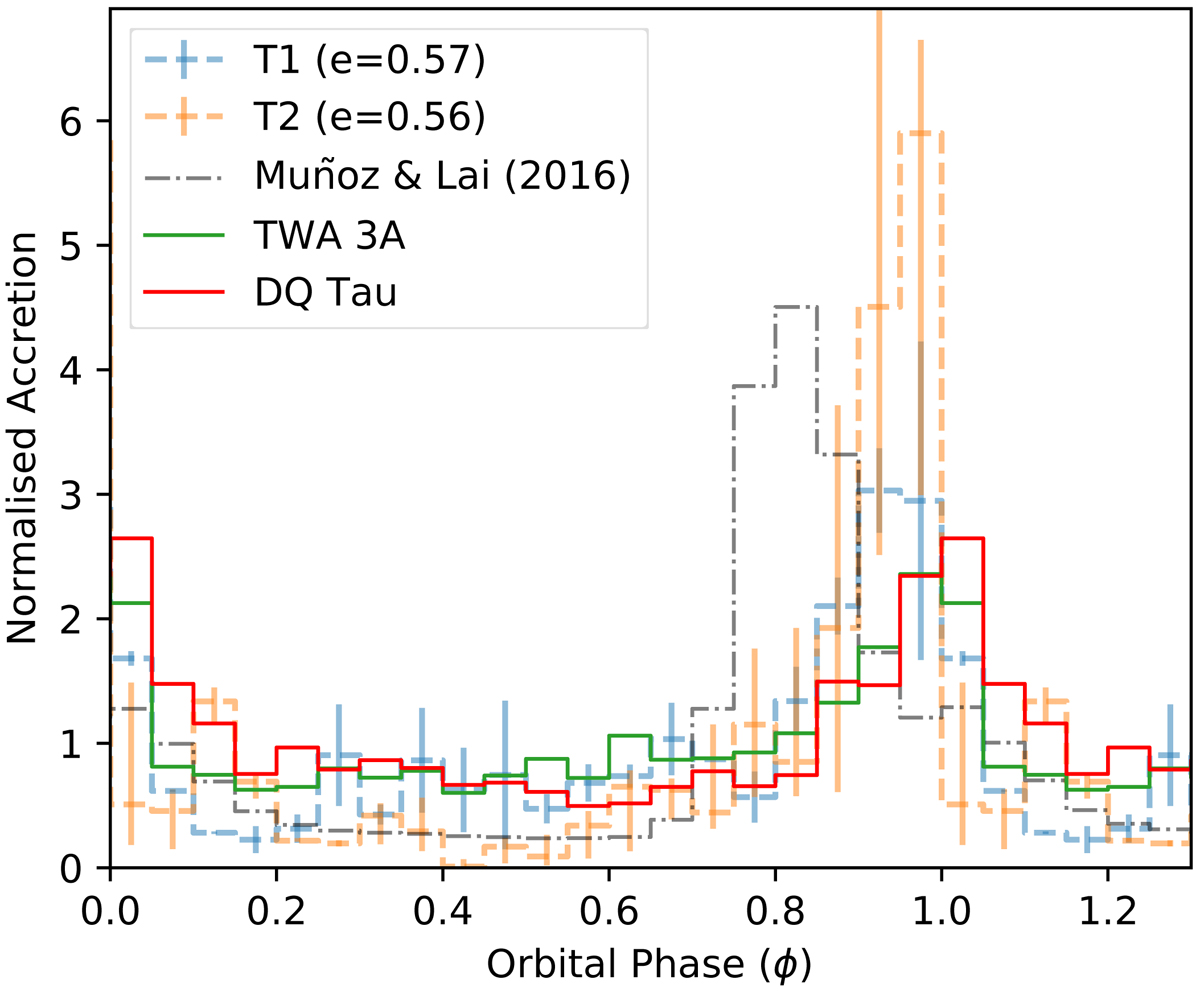
Normalised observed accretion rate for TWA 3A (solid green) and DQ Tau (solid red), against the simulated phase-folded accretion curves from T1 (dashed blue) and T2 (dashed orange), which have eccentricities similar to the observed systems. We also show the results of the simulations from Muñoz & Lai (2016) for a binary of eccentricity e = 0.5 (black dash-dotted line).
Current usage metrics show cumulative count of Article Views (full-text article views including HTML views, PDF and ePub downloads, according to the available data) and Abstracts Views on Vision4Press platform.
Data correspond to usage on the plateform after 2015. The current usage metrics is available 48-96 hours after online publication and is updated daily on week days.
Initial download of the metrics may take a while.