Free Access
Fig. 8.
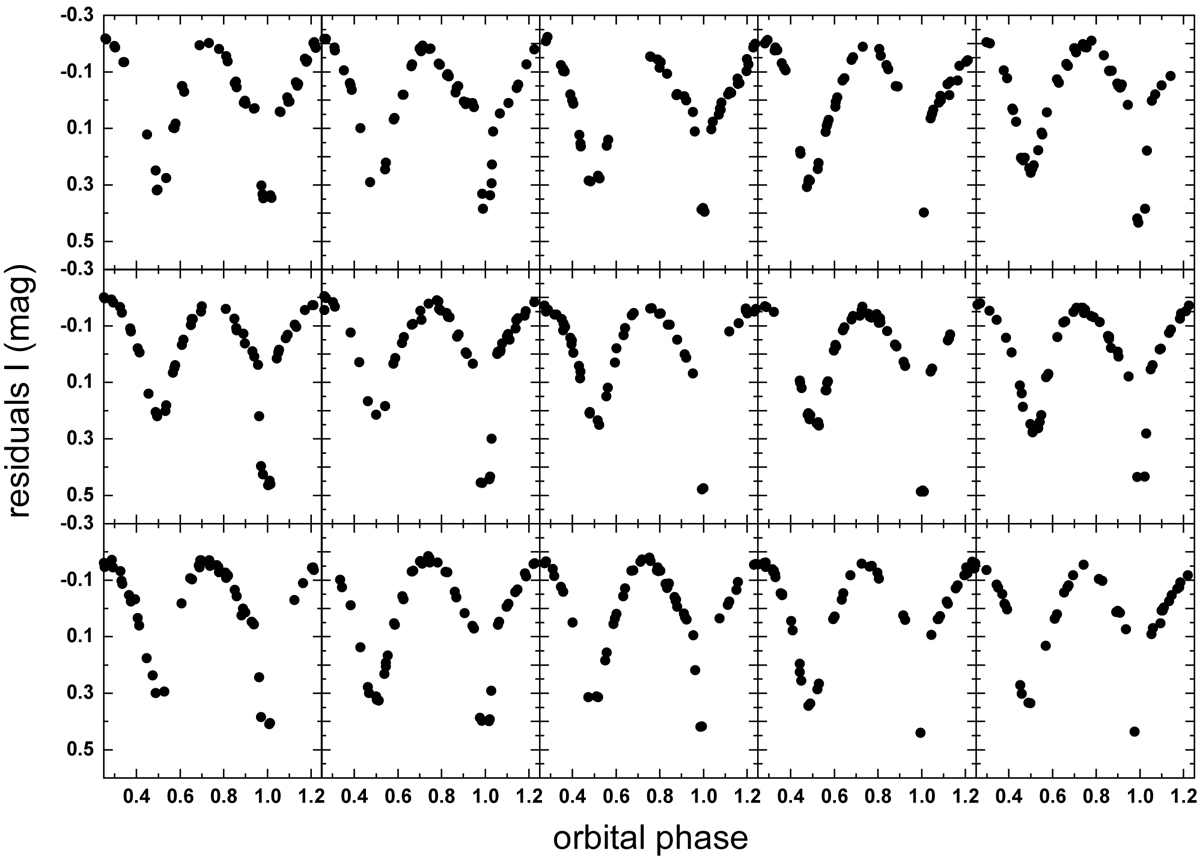
Orbital light curves constructed with residuals of the fits shown in Fig. 7 for data spanning the time interval (HJD-245000) between 6334.9 and 7332.5. Every panel shows 50 consecutive data points. Time goes from left to right from the upper left to the lower right panel.
Current usage metrics show cumulative count of Article Views (full-text article views including HTML views, PDF and ePub downloads, according to the available data) and Abstracts Views on Vision4Press platform.
Data correspond to usage on the plateform after 2015. The current usage metrics is available 48-96 hours after online publication and is updated daily on week days.
Initial download of the metrics may take a while.